
Opis
Wskaźniki Pinescriptlabs Store: cBoty Pinescriptlabs Store : (cBot) Gold & BTC BreakoutSession Pivots(nowy)
PRICE ACTION (Nowy)
Trailing Smart Algorithm (Nowy)
Prognoza oparta na Linreg & ATR
SmartTrend Wsparcie &
Opór
Linie
Dynamiczna
Struktura Rynku
Analiza
punktów
zwrotnych
Punktów
Fibonacci
Regresja
Liniowa
Wielookresowa
Wielopoziomowy
Śledzenie Kierunku Świec
Tracker
Auto
Wsparcie i
Opór
Trend
Linie
Wszystkie
Poziomy Wsparcia i
Opór
Poziomy
Opis:
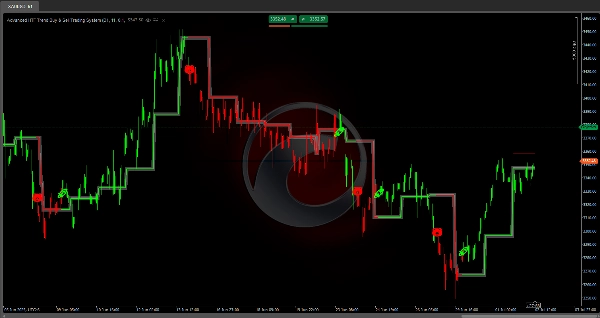
Zaawansowany system handlu kupna i sprzedaży na wyższych ramach czasowych (HTF)
Co to jest i do czego służy?
To algorytm analizy technicznej, który automatycznie identyfikuje poziomy wsparcia i oporu 📈 na podstawie historycznych zakresów cen, oraz wykrywa momenty, gdy cena przebija te poziomy, generując sygnały trendu 💡.
Jak działa logika?
1️⃣ Obliczanie zakresu
Wskaźnik analizuje zdefiniowany okres historyczny (w pełni konfigurowalny), aby znaleźć:
• najwyższą cenę osiągniętą w tym okresie 📊
• najniższą cenę osiągniętą w tym okresie 📉
• punkt środkowy pomiędzy tymi poziomami ⚖️
2️⃣ Ustalenie poziomów
Po zidentyfikowaniu ekstremów wskaźnik:
• Rysuje czerwoną linię na poziomie maksymalnym (opór)
• Rysuje zieloną linię na poziomie minimalnym (wsparcie)
• Dodaje bufor bezpieczeństwa do każdego poziomu, aby zapobiec fałszywym sygnałom 🛡️
3️⃣ Wykrywanie wybicia
System stale monitoruje cenę, aby wykryć:
• Wybicie wzrostowe 🚀: gdy cena zamyka się powyżej poziomu oporu + buforu
• Wybicie spadkowe 🐻: gdy cena zamyka się poniżej poziomu wsparcia - buforu
4️⃣ System potwierdzenia
Przed wygenerowaniem ostatecznego sygnału ✅ wskaźnik:
• Czeka na konfigurowalną liczbę kolejnych świec potwierdzających wybicie ⏳
• Dopiero po potwierdzeniu oficjalnie zmienia trend
5️⃣ Dynamiczna aktualizacja
Poziomy są automatycznie przeliczane:
• Gdy zaczyna się nowy okres (dzienny, tygodniowy lub miesięczny, w zależności od ustawień) 🔄
• Linie są wydłużane do momentu ustawienia nowych poziomów
• Linia środkowa zmienia kolor zgodnie z aktualnym trendem
Jak korzystać z ?
✨ Sygnały:
• Kupno: Symbol 🚀 pojawia się, gdy potwierdzone jest wybicie wzrostowe
• Sprzedaż: Symbol 🐻 pojawia się, gdy potwierdzone jest wybicie spadkowe
🎨 Kolorowanie świec:
• Świece są automatycznie kolorowane zgodnie z aktualnym trendem:
✅ Zielony: Aktywny trend wzrostowy
❌ Czerwony: Aktywny trend spadkowy
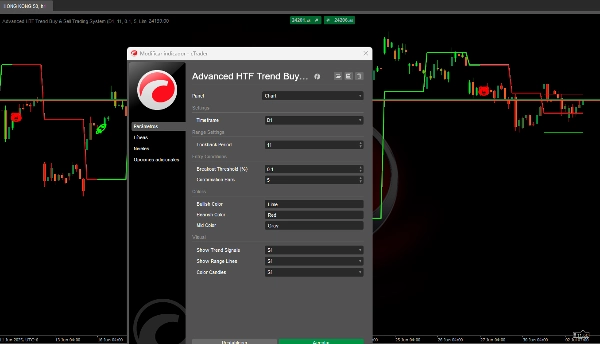
Ustawienia parametrów
🔧 Okres cofania (5–200, domyślnie: 11)
Co kontroluje?
Liczbę historycznych świec używanych do obliczania maksimów i minimów.
Wpływ po zmianie:
• Niskie wartości (5–15):
- Bardziej reaktywne i częstsze poziomy
- Większa liczba sygnałów
- Najlepsze dla skalpowania i krótkoterminowych transakcji
- Idealne dla bardzo zmiennych rynków
• Wysokie wartości (30–50):
- Bardziej stabilne i trwałe poziomy 🏛️
- Mniej, ale bardziej wiarygodnych sygnałów
- Lepsze dla tradingu wahadłowego i pozycji średnioterminowych
- Idealne dla bardziej stabilnych rynków
📏 Próg wybicia (0.01–5.0%, domyślnie: 0.1%)
Co kontroluje?
Dodatkowy bufor, który cena musi przekroczyć, aby potwierdzić wybicie.
Wpływ po zmianie:
• Niskie wartości (0.05–0.15%):
- Wcześniejsze i bardziej czułe sygnały 🔍
- Większe ryzyko fałszywych wybicia
- Idealne dla głównych par Forex z niskimi spreadami
- Najlepsze dla rynków o wysokiej płynności
• Wysokie wartości (0.3–1.0%):
- Późniejsze, ale bardziej wiarygodne sygnały 🛡️
- Mniejsze ryzyko szumów rynkowych
- Idealne dla kryptowalut i aktywów o dużej zmienności
- Najlepsze dla rynków z szerszymi spreadami
⏳ Świece potwierdzające (1–5, domyślnie: 1)
Co kontroluje?
Ile kolejnych świec musi potwierdzić wybicie przed wygenerowaniem sygnału.
Wpływ po zmianie:
• 1 świeca:
- Natychmiastowe sygnały ⚡
- Więcej okazji do handlu
- Większe ryzyko przedwczesnych sygnałów
- Idealne dla aktywnych traderów
• 2–3 świece:
- Równowaga między szybkością a wiarygodnością ⚖️
- Znacząco redukuje fałszywe sygnały
- Idealne dla większości strategii
• 4–5 świec:
- Bardzo konserwatywne sygnały 🕊️
- Maksymalna wiarygodność
- Może przegapić wczesne okazje
- Idealne dla pozycji długoterminowych
📊 Optymalizacja według typu aktywów
💱 Główne pary Forex (EUR/USD, GBP/USD, itd.)
• Okres cofania: 15–25
• Próg: 0.05–0.15%
• Potwierdzenie: 1–2 świece
💰 Kryptowaluty
• Okres cofania: 10–20
• Próg: 0.2–0.8%
• Potwierdzenie: 2–3 świece
📈 Indeksy giełdowe
• Okres cofania: 20–30
• Próg: 0.1–0.3%
• Potwierdzenie: 1–2 świece
🌾 Surowce
• Okres cofania: 25–35
• Próg: 0.15–0.4%
• Potwierdzenie: 2–3 świece
Uwagi
• Może generować opóźnione sygnały na bardzo szybko zmieniających się rynkach 🏃♂️
• Mniej skuteczny na ekstremalnie bocznych rynkach
• Wymaga dostosowania parametrów w zależności od aktywów i ram czasowych ⏱️
Podsumowanie
The system continuously monitors price action to detect bullish breakouts (price closing above resistance plus buffer) and bearish breakouts (price closing below support minus buffer). It includes a confirmation mechanism that waits for a configurable number of consecutive bars confirming the breakout before officially signaling a trend change. The midpoint line changes color to reflect the current trend, and all levels update dynamically at the start of new periods (daily, weekly, or monthly).
Signals are visually indicated with symbols: a rocket (🚀) for confirmed bullish breakouts and a bear (🐻) for confirmed bearish breakouts. Candles are colored green for active bullish trends and red for bearish trends.
Key adjustable parameters include lookback period (5–200 bars), breakout threshold buffer (0.01–5.0%), and confirmation bars (1–5). These settings can be optimized for various asset types such as Forex majors, cryptocurrencies, stock indices, and commodities, balancing signal frequency, reliability, and market conditions. The indicator supports multiple timeframes and is suitable for scalping, swing trading, and longer-term strategies depending on configuration.