🚀 Lebih 10,000 pedagang sudah menggunakan penunjuk UTAMA kami 🏆 …dan komuniti terus berkembang!
Temui mengapa profesional memilih kami – alat paling berkuasa cTrader (penunjuk + algoritma + cBots) menanti anda.
👉 Dapatkan semua sistem UTAMA kami di sini:
Penunjuk Kedai Pinescriptlabs: cBots Kedai Pinescriptlabs : (cBot) Gold & BTC BreakoutSession Pivots(baru)
Struktur Pasaran Lanjutan: Bos, Choch, SwinLevels, Blok Pesanan, Pencari Struktur Pasaran & Kecairan (Baru)
Algoritma Pintar Trailing (baru)
Ramalan Berdasarkan Linreg & ATR
Sokongan &
Garis Rintangan
SmartTrend
Analisis
Struktur Pasaran
Dinamik
dari
Titik
Pusingan
Fibonacci
Regresi
Linear
Berbilang jangka masa
Penjejak
Bias Lilin
Berbilang Tahap
Garis
Trend Sokongan dan
Rintangan Auto
Semua
Tahap Sokongan dan
Rintangan
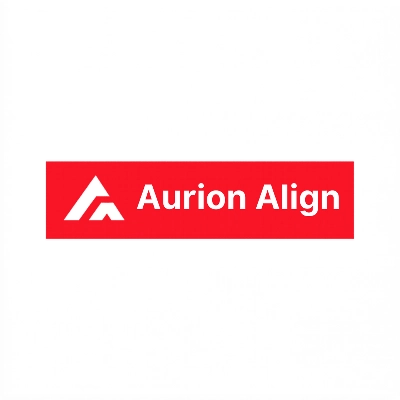
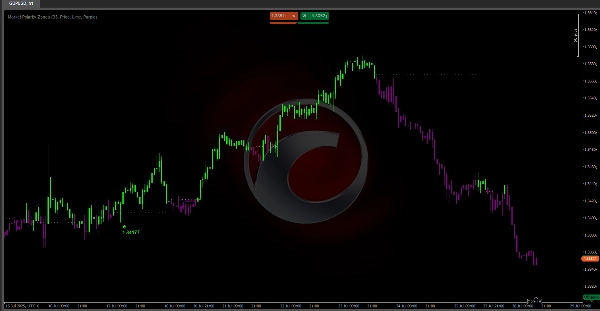
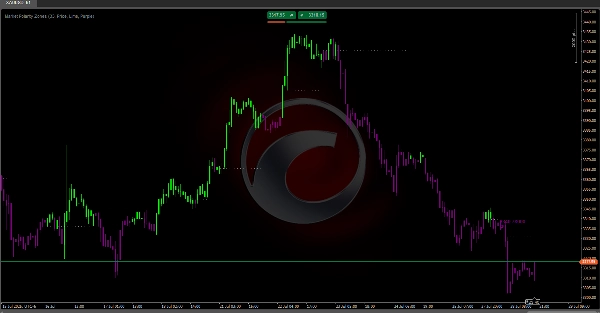
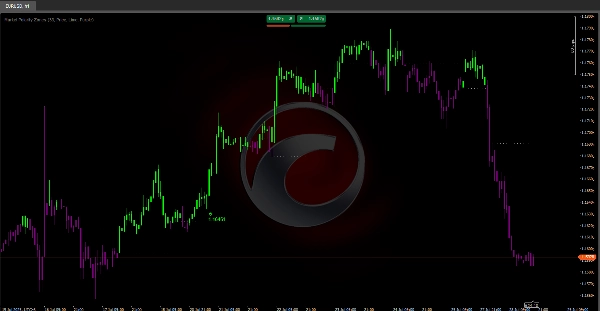
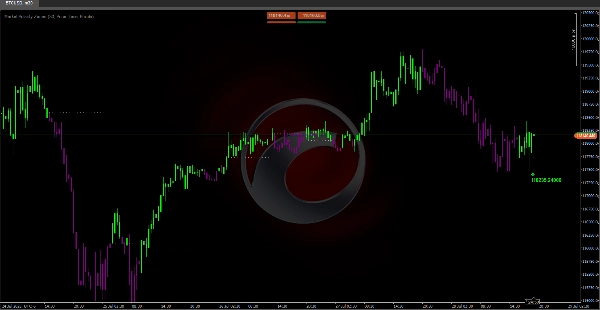
Zon Polariti Pasaran 📊
Apa yang dilakukan oleh algoritma ini?
Zon Polariti Pasaran adalah penunjuk lanjutan yang memudahkan analisis pasaran dengan secara automatik mengenal pasti fasa bullish 🚀 atau bearish 🐻 dan menandakan tahap utama di mana pembalikan trend mungkin berlaku.
Sesuai untuk:
- Pedagang tindakan harga
- Pedagang ayunan
- Scalper,...yang perlu dengan cepat mengenal pasti arah pasaran dan titik masuk/keluar yang tepat.
Bagaimana logiknya berfungsi?
Algoritma menggunakan dua Purata Pergerakan Hull (HMA) dengan tempoh berbeza untuk mengesan perubahan momentum dan menetapkan tahap dinamik seperti berikut:
- Mengesan persilangan HMA untuk mengenal pasti perubahan trend.
- Menetapkan tahap automatik:
-
- Persilangan bullish → Menandakan rendah sebagai tahap sokongan
- Persilangan bearish → Menandakan tinggi sebagai tahap rintangan
- Mengekalkan tahap aktif sehingga persilangan baru berlaku.
Apa yang akan anda lihat pada carta anda:
🎨 Sistem warna intuitif:
- Lilin hijau 🟢: Harga di atas tahap (zon bullish – cari pembelian)
- Lilin ungu 🟣: Harga di bawah tahap (zon bearish – cari penjualan)
📉 Garis tahap dinamik:
- Garis mendatar bertitik menandakan tahap polariti aktif
- Memanjang secara automatik selagi tahap itu sah
- Hanya muncul apabila tahap itu stabil
⚠️ Amaran pembalikan:
Label anak panah muncul apabila corak tertentu terbentuk:
- 🔻 Pembalikan Bearish (label ungu):
-
- Corak: Harga naik → gagal → jatuh di bawah tahap
- Maksud: Tekanan bullish melemah, kemungkinan beralih ke zon bearish
- 🔺 Pembalikan Bullish (label hijau):
-
- Corak: Harga jatuh → memantul → naik di atas tahap
- Maksud: Pembeli mempertahankan tahap, kemungkinan beralih ke zon bullish
ℹ️ Maklumat label:
- "Harga": Menunjukkan titik kegagalan breakout tepat – gunakan untuk hentian tepat atau mengenal pasti rintangan/sokongan utama.
- "Isipadu": Jumlah isipadu 3 bar terakhir – mengesahkan jika pembalikan mempunyai penyertaan pasaran sebenar.
Tetapan yang disyorkan:
- Panjang: 33 (lalai) – Berfungsi dengan baik untuk kebanyakan pasaran
- Data Label: "Harga" untuk ketepatan tahap, "Isipadu" untuk pengesahan
- Warna: Kekalkan Lime/Ungu untuk kontras visual terbaik 🎨