
Penerangan
ALGORITMA ini adalah alat teknikal canggih 🔧 direka untuk mengautomasikan pengesanan corak harga geometri (Corak Harmonik) dan struktur pasaran berdasarkan tindakan harga. Matlamat utamanya adalah untuk mengenal pasti zon pembalikan tren berpotensi dengan kebarangkalian tinggi 📍.
https://chartshots.spotware.com/c/693330cd99c57
Apa yang dilakukan oleh algoritma ini?
Algoritma mengimbas carta dalam masa nyata 🔍 mencari pembentukan harga tertentu. Ia berfungsi pada dua tahap:
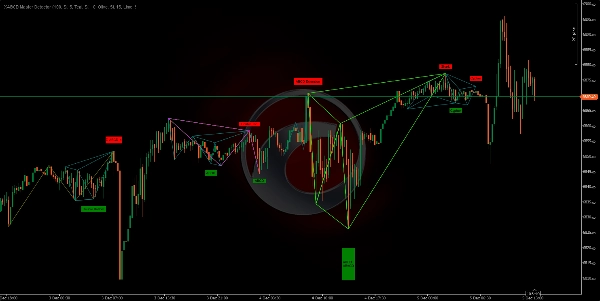
- Pemetaan Struktur (ZigZag): Pertama, ia memudahkan bunyi pasaran dengan melukis garis "ZigZag" yang menghubungkan paras tinggi dan rendah yang relevan (pivot). Ia menggunakan sehingga 4 panjang berbeza secara serentak 📏 untuk menangkap tren kecil (jangka pendek) dan besar (jangka panjang).
- Pengenalan Corak: Setelah titik pivot ini (titik A, B, C, D, X) dikenal pasti, algoritma mengukur jarak dan nisbah antara mereka. Jika nisbah ini sepadan dengan peraturan matematik corak perdagangan klasik (seperti Fibonacci), penunjuk melukis corak tersebut dan memberi amaran kepada pengguna 🚨.
Untuk apa ia digunakan?
Ia berfungsi untuk menghapuskan subjektiviti apabila melukis corak kompleks dan menjimatkan masa analisis ⏳. Daripada mengukur setiap retracement dan lanjutan Fibonacci secara manual, penunjuk melakukannya secara automatik untuk:
- Mengesan Pembalikan: Cari titik di mana harga boleh berubah arah (dari bullish ke bearish atau sebaliknya). 🔄
- Kenal Pasti Titik Masuk: Isyarat zon tepat ("Zon Pembalikan Potensi") untuk memasuki pasaran. 🎯
- Sahkan Analisis: Berfungsi sebagai konfluens tambahan kepada strategi sokongan/rintangan anda sendiri.
Logik di sebalik pengiraan
Teras penunjuk berdasarkan Nisbah Fibonacci dan simetri pasaran ⚖️. Algoritma mengesahkan peraturan ketat untuk setiap corak. Contohnya, untuk mengesahkan corak "Gartley", algoritma mengira secara dalaman:
- Jika retracement titik B berbanding kaki XA adalah tepat (atau sangat hampir kepada) 0.618.
- Jika unjuran titik D memenuhi nisbah tertentu.
Penunjuk membenarkan sedikit margin kesilapan (boleh dikonfigurasikan) kerana pasaran jarang sempurna hingga pip yang tepat. Ia juga mengira nisbah Risiko/Imbuhan teoretikal sebelum memaparkan corak.
Corak yang dikesan:
https://chartshots.spotware.com/c/6933314cb9fa1
- Klasik: Double Top dan Double Bottom. 🏔️🏞️
- Harmonik: Gartley, Bat 🦇, Butterfly 🦋, Crab 🦀, Deep Crab, Shark 🦈, Cypher.
- Struktur ABCD: ABCD Klasik, AB=CD, ABCD Lanjutan.
- Eksotik: Three Drives, 5-0.
https://chartshots.spotware.com/c/6933317ae4324
Bagaimana menggunakannya?
Persediaan Visual:
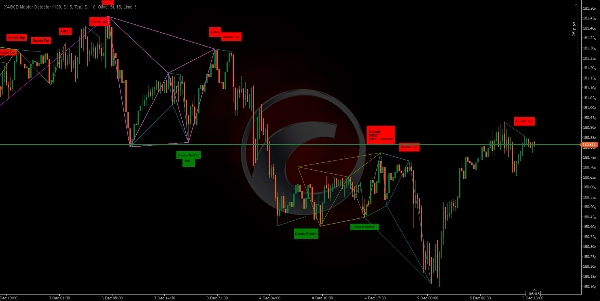
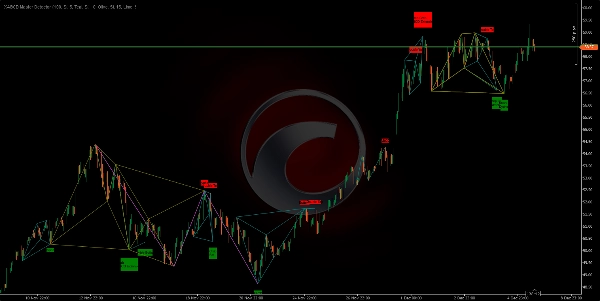
- Anda akan melihat garis berwarna menghubungkan puncak dan lembah.
- Apabila corak lengkap, satu figura geometri berwarna dan label dengan nama corak (contoh, "Gartley", "Double Top") akan muncul.
- Label Hijau: Menunjukkan corak bullish (cari peluang beli). 📈
- Label Merah: Menunjukkan corak bearish (cari peluang jual). 📉
Interpretasi:
- Jangan berdagang setiap label secara membuta tuli. Gunakan ia sebagai isyarat amaran.
- Apabila corak muncul, tunggu harga bertindak balas di zon D (titik terakhir corak).
- Cari pengesahan tambahan (seperti lilin pembalikan Jepun atau divergensi RSI) sebelum masuk.
Penyesuaian Utama:
- Anda boleh mengaktifkan atau menyahaktifkan corak tertentu jika anda hanya suka berdagang beberapa corak (contoh, hanya "Bat" dan "Gartley"). ✅
- Anda boleh melaraskan sensitiviti ZigZag untuk melihat pergerakan lebih pantas atau tren lebih perlahan. ⚙️
🏆 Lebih 10,000 Pedagang Mempercayai Suite Algoritma 25+ Kami! 🏆
Dari Struktur Pasaran & Kecairan ke Sistem Keluar Pintar & Alat Ramalan - kami telah membina SETIAP alat yang anda perlukan untuk konsistensi.
👉 Akses Semua 25+ Sistem TERBUKTI:
_______________________________________________
📌 Penunjuk Struktur Pasaran
· ✅ Struktur Pasaran Lanjutan: Bos, Choch, SwinLevels, Blok Pesanan, Pencari Struktur Pasaran& Kecairan
· 🔄 Analisis Struktur Pasaran Dinamik Titik Balik
· 🧱 Blok Pesanan
· ⚖️ Ketidakseimbangan Pasaran
· ⛓️ BOS & CHOCH
· 🧠 Kuasa ICT 3
_______________________________________________
🔚 Sistem Keluar Pintar
_______________________________________________
📐 Penunjuk ZigZag
· 🔍 Unjuran Kecairan Harga ZigZag
· ➖ ZigZag
· 🎯 Penjejak Ekstremiti Zig-Zag
_______________________________________________
🧱 Penunjuk Sokongan & Rintangan
· 🟩 Garis Sokongan & Rintangan SmartTrend
· 🧱 Semua Tahap Sokongan dan Rintangan
_______________________________________________
📊 Penunjuk Tren & Saluran
· 📊 Supertrend
_______________________________________________
💧 Alat Isipadu & Kecairan
· 🔍 Jurang Nilai Adil Momentum
_______________________________________________
⚡ Penunjuk Momentum & RSI
· 🔎 Penjejak Bias Lilin Berbilang Tahap
_______________________________________________
🔮 Alat Ramalan & Unjuran
· 📐 Ramalan Berdasarkan Linreg& ATR
· 📏 Regresi Linear Fibonacci Berbilang Jangka Masa
· 📈 Pemproyektor Aliran Pasaran Dikuasakan Isipadu_________________________
_________________________________________________________________________________________________
_________________________________________________________________________________________________
PENCETUS SALURAN RSI: 📶
Apa itu: Penunjuk yang mengira RSI(tempoh) dan menandakan zon momentum secara visual apabila RSI melintasi ambang terlebih beli/terlebih jual (lalai 70/30). ✅
https://chartshots.spotware.com/c/69278f8b6d973
Logik: Apabila ambang dilintasi, ia mencipta "zon" berdasarkan tinggi/rendah lilin pada saat lintasan. Kemudian: 🧠
- Mewarnakan lilin di dalam zon tersebut.
- Melukis saluran (tinggi, rendah, tengah).
- Menandakan lintasan pada panel RSI dengan bulatan dan label.
Zon itu berlangsung selama tepat MinZoneDuration bar. ⏱️
Isyarat jelas:
- Lintasan di atas Terlebih Beli → memulakan zon bullish. 🟢
- Lintasan di bawah Terlebih Jual → memulakan zon bearish. 🔴
Zon itu sendiri adalah kawasan minat, bukan pesanan.
https://chartshots.spotware.com/c/69278fb274e0b
Cara guna (pantas):
- Tunggu zon terbentuk. 🎯
- Sahkan dengan tindakan harga (pecahan/tolakan dari garis saluran).
- Masuk dengan stop loss di luar zon dan sasaran di garis tengah saluran atau nisbah Risiko/Imbuhan yang ditetapkan.
https://chartshots.spotware.com/c/69278fe76237b
Parameter Utama: ⚙️
- Tempoh RSI (14)
- Terlebih Beli (70)
- Terlebih Jual (30)
- MinZoneDuration (15)
- Warna boleh dikonfigurasikan 🎨
Ringkasan
The algorithm recognizes classic and complex patterns—including Double Top/Bottom, Gartley, Bat, Butterfly, Crab, Deep Crab, Shark, Cypher, ABCD structures, and exotic patterns like Three Drives and 5-0—by measuring distances and Fibonacci ratios between pivot points. Upon pattern completion, it visually displays colored geometric figures and labels indicating bullish (green) or bearish (red) signals.
Users can customize pattern detection and ZigZag sensitivity to suit their trading preferences. The indicator supports various markets such as Forex, commodities, indices, stocks, and cryptocurrencies, including symbols like EURUSD, GBPUSD, BTCUSD, XAUUSD, NAS100, and USDJPY.
XABCD Master Detector aims to reduce subjectivity and save analysis time by automatically calculating Fibonacci retracements, extensions, and theoretical risk/reward ratios. It serves as an alert tool to detect reversals, identify entry points, and provide additional confluence to existing support/resistance strategies.
Ulasan pelanggan
5 | 100 % | |
4 | 0 % | |
3 | 0 % | |
2 | 0 % | |
1 | 0 % |


