Opis
Wskaźniki Pinescriptlabs Store: Pinescriptlabs Store cBoty : (cBot) Gold & BTC BreakoutSession Pivots(nowy)
Projekcja płynności ceny ZigZag
Inteligentny algorytm podążający (nowy)
Prognoza oparta na Linreg & ATR
SmartTrend wsparcie &
opór
linie
Dynamiczna
analiza struktury rynku
punktów zwrotnych
Punkty
Fibonacci
regresja liniowa
wieloczasowa
Multi-timeframe
Luka wartości godziwej momentum
Wielopoziomowy
śledzenie nachylenia świec
Tracker
Automatyczne
wsparcie i
opór
linie trendu
linie
Wszystkie
wsparcia i
opory
poziomy
🌟 Świetny wysiłek zespołu w rozwijaniu tego wskaźnika Ctrader! Wspieraj nas, udostępniając - wkrótce ulepszenia wizualne, w tym przewijanie poziome!
⚠️ Uwaga techniczna: Obecnie wymagane jest ręczne powiększanie/przewijanie dla optymalnego widoku ("Tymczasowe ograniczenie: Najlepiej działa na interwałach poniżej 1H ze względu na ograniczenia wizualne platformy Ctrader")
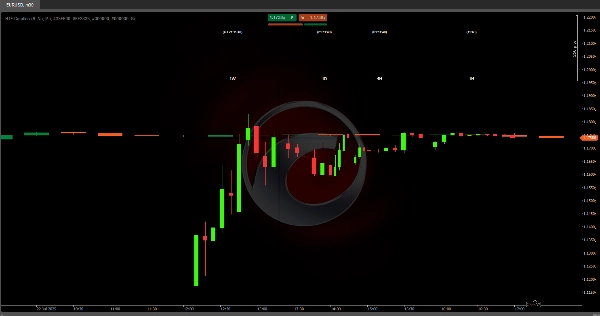
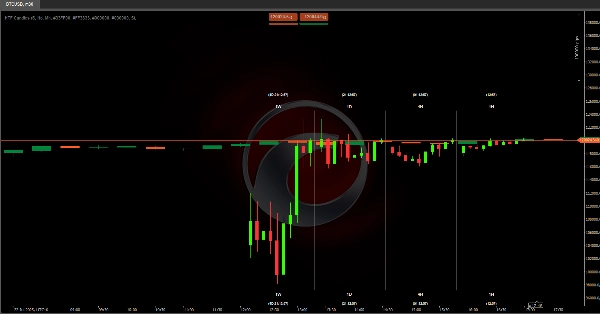
📊 Wizualizacja HTF w czasie rzeczywistym
Ten algorytm wyświetla świece wyższych interwałów (1W, 1D, 4H, 1H) bezpośrednio na Twoim wykresie handlowym, dając pełną strukturę rynku na pierwszy rzut oka - bez potrzeby zmiany okien!
🔍 Szybka analiza
Wykrywaj główne trendy (kierunek dzienny/tygodniowy) podczas handlu na niższych interwałach
• Zaawansowana funkcja: Świece HTF aktualizują się w czasie rzeczywistym - zmiany koloru natychmiast pokazują zmiany momentum
⚙️ Jak używać
• Włączaj/wyłączaj poszczególne bloki HTF
• Dostosuj widoczne świece (1-10 na interwał)
💡 Przełomowe korzyści
Teraz możesz:
1️⃣ Przewidywać kluczowe zamknięcia świec
2️⃣ Wykrywać odwrócenia trendów na żywo
3️⃣ Monitorować kluczowe poziomy na wielu interwałach jednocześnie
🚀 Nadchodzące ulepszenia
Przewijanie poziome umożliwi:
• Analizę historycznych wzorców HTF
• Porównanie aktualnej i przeszłej struktury
• Identyfikację kluczowych stref na wyższych interwałach
📚 Praktyczne przykłady
• Gdy 1W = zielony & 1D = czerwony → Rynek koryguje się w trendzie wzrostowym → Krótkie pozycje tylko przy odbiciach od kluczowego oporu
• Hierarchia trendów: 1W > 1D > 4H > 1H → Zawsze handluj zgodnie z kierunkiem świecy tygodniowej
• Wejścia konfluencyjne:
- Cena przy wsparciu 1D + pojawiająca się zielona świeca 4H = okazja na pozycję długą
- Opór przy maksimum 1H + czerwona świeca 4H = pozycja krótka ze stopem powyżej maksimum
• Wzorce wybicia: - Jeśli świeca 1H przebije poprzednie maksimum przed zamknięciem (timer aktywny), oczekuj kontynuacji wzrostowej
Podsumowanie
Users can toggle individual higher timeframe candle blocks on or off and adjust the number of visible candles per timeframe (1 to 10). This facilitates monitoring of key levels and trend directions across multiple timeframes simultaneously. Practical use cases include anticipating candle closings, detecting live trend reversals, and identifying confluence entries based on support, resistance, and candle color changes.
Due to platform visual constraints, manual zoom and scroll are currently required for optimal viewing, especially on timeframes below 1 hour. Planned updates will introduce horizontal scrolling to enable historical pattern analysis, comparison of current versus past structures, and identification of key zones on higher timeframes.
HTF Candles supports traders in aligning trades with higher timeframe trends and enhances multi-timeframe market analysis within a single chart view.