Description
🚀 10,000+ traders already use our TOP indicators🏆
👉 Get all our TOP systems here:
_______________________________________________
📌 Market Structure Indicators
· ✅ AdvancedMarket Structure: Bos, Choch, SwinLevels, Order Blocks, Market Structure& Liquidity Finder
· 🔄 Dynamic Market StructureAnalysis of Turning Points
· 🧱 Order Block
· ⚖️ Market Imbalance
· ⛓️ BOS & CHOCH
· 🧠 ICT Power of 3
_______________________________________________
🔚 Smart Exit Systems
_______________________________________________
📐 ZigZag Indicators
· 🔍 ZigZag Price LiquidityProjection
· ➖ ZigZag
_______________________________________________
🧱 Support & Resistance Indicators
· 🟩 SmartTrend Support &Resistance Lines
· 🧱 All Support and ResistanceLevels
_______________________________________________
📊 Trend & Channel Indicators
· 📊 Supertrend
_______________________________________________
💧 Volume & Liquidity Tools
_______________________________________________
⚡ Momentum & RSI Indicators
· 🔎 Multi-Level Candle Bias
Tracker
_______________________________________________
🔮 Prediction & Projection Tools
· 📐 Prediction Based on Linreg& ATR
· 📏 Fibonacci Linear RegressionMulti-timeframe
· 📈 Volume-Powered Market Flow Projector
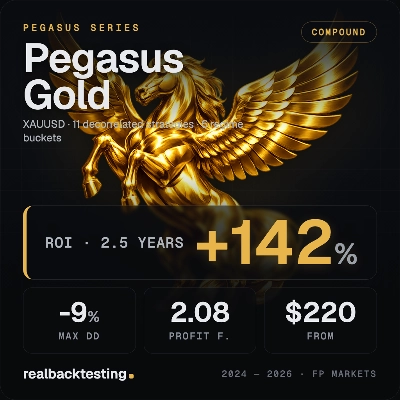
🚀 Recommended Assets
Exclusively for GOLD (XAUUSD) & BITCOIN (BTC) – Our AI-powered algorithm dynamically identifies entry points without being tied to specific timeframes ⏳, ensuring flawless adaptability across all market conditions.
📊 Backtesting Period
• 5 years of historical data for both Gold (XAUUSD) and BTC – rigorously tested for reliability.
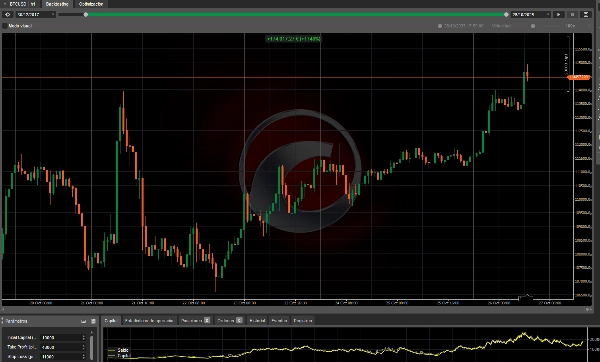
💰 BTC Trading Parameters
• 🎯 Take Profit (TP): 44,000 pips
• 🛑 Stop Loss (SL): 11,000 pips
• ⚖️ Risk-Reward Ratio (RR): 4:1 (TP/SL = 44,000/11,000)
• 📈 TP Range: 40,000 – 55,000 pips
• 📉 SL Range: 9,500 – 14,400 pips
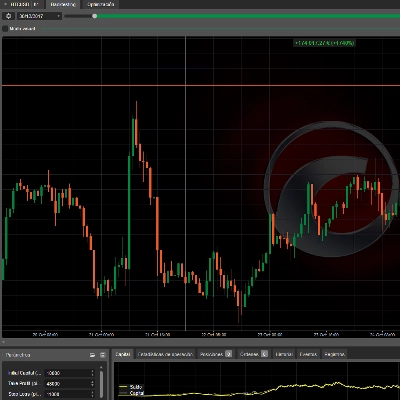
🌟 XAUUSD (Gold) Trading Parameters
• 🎯 Take Profit (TP): 4,700 pips
• 🛑 Stop Loss (SL): 1,700 pips
• ⚖️ Risk-Reward Ratio (RR): 2.76:1 (TP/SL = 4,700/1,700)
• 📈 TP Range: 4,200 – 6,100 pips
• 📉 SL Range: 1,300 – 2,400 pips
🔑 Key Features
- 🤖 Algorithm-Driven Entries
- No manual timeframe selection! Our system analyzes real-time data to pinpoint high-probability trades.
- 🎯 Flexible TP/SL Ranges
- Adjusts dynamically to volatility, staying within tested boundaries for optimal performance.
- 📅 Backtested & Proven
- Parameters refined over 5 years of Gold/BTC data – battle-tested for consistency.
📜 How the Algorithm Works
🔍 Technical Foundation
Our algorithm leverages advanced technical analysis to identify critical zones and major price movements during weekly sessions. Here’s the breakdown:
📌 Pivot Points & Key Levels
- Uses mathematical formulas to detect weekly support/resistance levels and pivot points – proven markers for trend reversals or accelerations.
💥 Breakout Detection
- Monitors price action relative to these levels.
- Validates breakouts with internal strength metrics to confirm sustainable trends.
⚡ Dynamic Risk Management
- "Risk per operation" is a % of your current balance – not just initial capital.
- Example: 2% risk = 2% of your live account balance (auto-adjusts after wins/losses).
🔄 False Breakout Recovery
- If a trade hits SL (fake breakout), the algorithm flips the position to capitalize on the reversal – turning losses into opportunities.
🚨 Exploiting Big Moves
- Focuses on weekly session breakouts where major price shifts occur.
- Combines breakout validation + dynamic sizing to maximize gains while strictly controlling risk.
🎯 In Summary
This algorithm targets high-probability breakouts at weekly pivot points, using real-time strength analysis to enter trades. If the market reverses, it automatically counters to recover losses. The result? Big wins, minimized risks, and adaptive trading – all backed by 5 years of data.
Summary
Customer reviews
5 | 0 % | |
4 | 100 % | |
3 | 0 % | |
2 | 0 % | |
1 | 0 % |