🚀 Mais de 10.000 traders já usam nossos principais indicadores 🏆 …e a comunidade continua crescendo!
Descubra por que os profissionais nos escolhem – as ferramentas mais poderosas do cTrader (indicadores + algoritmos + cBots) estão esperando por você.
👉 Obtenha todos os nossos sistemas TOP aqui:
Indicadores da Pinescriptlabs Store: cBots da Pinescriptlabs Store : (cBot) Gold & BTC BreakoutSession Pivots(novo)
Projeção de Liquidez de Preço ZigZag
Algoritmo Inteligente de Trailing (novo)
Mapa de Liquidação de Alavancagem
Previsão Baseada em Linreg & ATR
Suporte & SmartTrend
Resistência
Linhas
Sistema de Rompimento de Canal
Análise
Dinâmica da Estrutura
de Mercado
de
Pontos
de Virada
Regressão
Linear
Fibonacci
Multi-temporal
Gap de Valor Justo de Momentum
Gradiente de Tendência Dinâmico
Rastreador
de Viés
de Vela Multi-Nível
Rastreador de Extremos Zig-Zag
Linhas
de Tendência
de Suporte e
Resistência
Automáticas
Todos
os Níveis
de Suporte e
Resistência
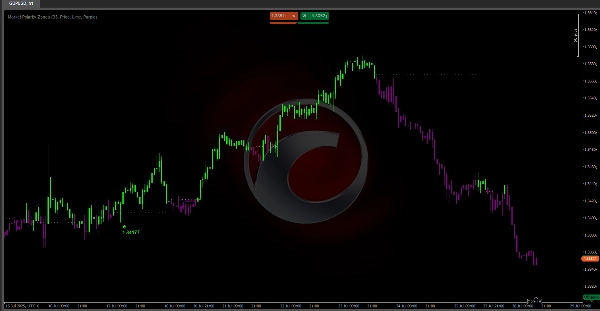
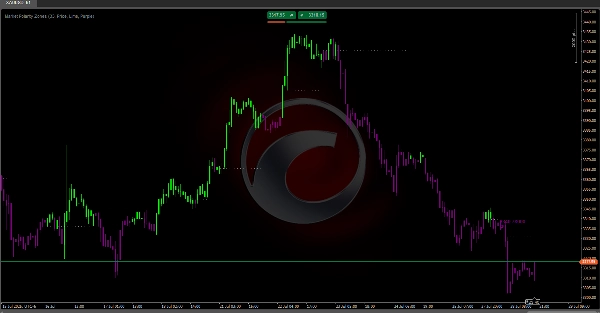
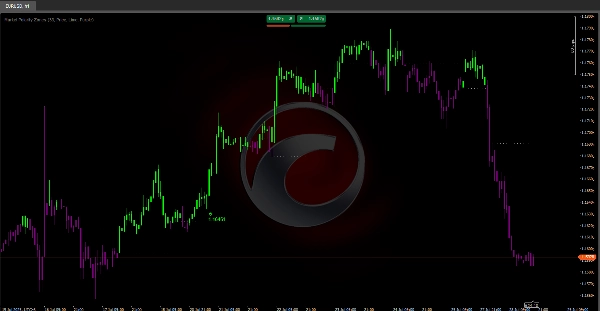
Zonas de Polaridade de Mercado 📊
O que este algoritmo faz?
Zonas de Polaridade de Mercado é um indicador avançado que simplifica a análise de mercado identificando automaticamente fases de alta 🚀 ou baixa 🐻 e marcando níveis-chave onde reversões de tendência são prováveis.
Ideal para:
- Traders de price action
- Traders de swing
- Scalpers,... que precisam identificar rapidamente a direção do mercado e pontos precisos de entrada/saída.
Como funciona a lógica?
O algoritmo usa duas Médias Móveis Hull (HMA) com períodos diferentes para detectar mudanças de momentum e define níveis dinâmicos da seguinte forma:
- Detecta cruzamentos das HMA para identificar mudanças de tendência.
- Define níveis automáticos:
-
- Cruzamento de alta → Marca a mínima como nível de suporte
- Cruzamento de baixa → Marca a máxima como nível de resistência
- Mantém o nível ativo até que ocorra um novo cruzamento.
O que você verá no seu gráfico:
🎨 Sistema de cores intuitivo:
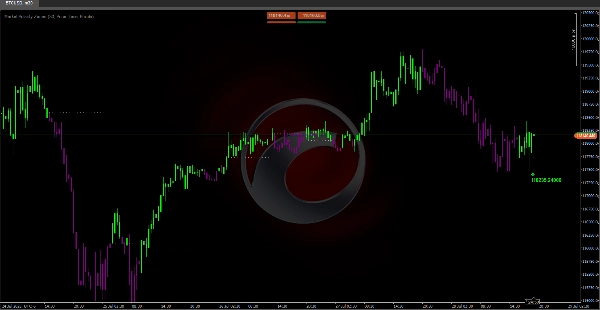
- Velas verdes 🟢: Preço acima do nível (zona de alta – procure compras)
- Velas roxas 🟣: Preço abaixo do nível (zona de baixa – procure vendas)
📉 Linhas de nível dinâmico:
- Linhas horizontais pontilhadas marcando o nível ativo de polaridade
- Estendem-se automaticamente enquanto o nível permanece válido
- Aparecem apenas quando o nível se estabiliza
⚠️ Alertas de reversão:
Etiquetas de seta aparecem quando padrões específicos se formam:
- 🔻 Reversão de baixa (etiqueta roxa):
-
- Padrão: Preço sobe → falha → cai abaixo do nível
- Significado: Pressão de alta enfraquecendo, possível mudança para zona de baixa
- 🔺 Reversão de alta (etiqueta verde):
-
- Padrão: Preço cai → rebate → sobe acima do nível
- Significado: Compradores defendendo o nível, possível mudança para zona de alta
ℹ️ Informações das etiquetas:
- "Preço": Mostra o ponto exato de falha do rompimento – use para stops precisos ou para identificar resistência/suporte chave.
- "Volume": Soma do volume das últimas 3 barras – confirma se a reversão tem participação real do mercado.
Configurações recomendadas:
- Comprimento: 33 (padrão) – Funciona bem para a maioria dos mercados
- Dados da Etiqueta: "Preço" para precisão do nível, "Volume" para confirmação
- Cores: Mantenha Lime/Roxo para melhor contraste visual 🎨