Descrição
🚀 Mais de 10.000 traders já usam nossos principais indicadores🏆
Descubra por que os profissionais nos escolhem – as ferramentas mais poderosas no cTrader (indicadores, algoritmos e cBots) estão esperando por você.
👉 Obtenha todos os nossos principais sistemas aqui:
_______________________________________________
_______________________________________________
📌 Indicadores de Estrutura de Mercado
· ✅ AdvancedMarket Structure: Bos, Choch, SwinLevels, Order Blocks, Market Structure& Liquidity Finder
· 🔄 Análise Dinâmica da Estrutura de Mercado de Pontos de Virada
· 🧱 Order Block
· ⚖️ Market Imbalance
· ⛓️ BOS & CHOCH
· 🧠 ICT Power of 3
______________________________________________________________-
Loja de cBots : 🧠 Gold & BTC BreakoutSession Pivots 🧠
_______________________________________________
🔚 Sistemas de Saída Inteligente
· 📍 Algoritmo Inteligente de Trailing
_______________________________________________
📐 Indicadores ZigZag
· 🔍 Projeção de Liquidez de Preço ZigZag
· ➖ ZigZag
· 🎯 Rastreador de Extremos Zig-Zag
_______________________________________________
🧱 Indicadores de Suporte e Resistência
· 🟩 Linhas de Suporte e Resistência SmartTrend
· 🧱 Todos os Níveis de Suporte e Resistência
_______________________________________________
📊 Indicadores de Tendência e Canal
· 🔄 Canal de Tendência Automático
· 📊 Supertrend
· ⚡Analisador de Tendência Momentum
· 🧠 Canal de Tendência Adaptativo
· 💥 Sistema de Rompimento de Canal
· 🌈 Gradiente Dinâmico de Tendência
_______________________________________________
💧 Ferramentas de Volume e Liquidez
· 📉 Mapa de Liquidação de Alavancagem
· 🔍 Gap de Valor Justo Momentum
· 🕒 Sessões de Gap de Valor Justo
_______________________________________________
⚡ Indicadores de Momentum e RSI
· 🚀 Momentum de Alcance Dinâmico
· 🔎 Rastreador de Viés de Vela Multi-Nível
_______________________________________________
🔮 Ferramentas de Previsão e Projeção
· 📐 Previsão Baseada em Linreg& ATR
· 📏 Regressão Linear de Fibonacci Multi-tempo
· 📈 Projetor de Fluxo de Mercado Alimentado por Volume
_________________________________________________________________________________
_________________________________________________________________________________
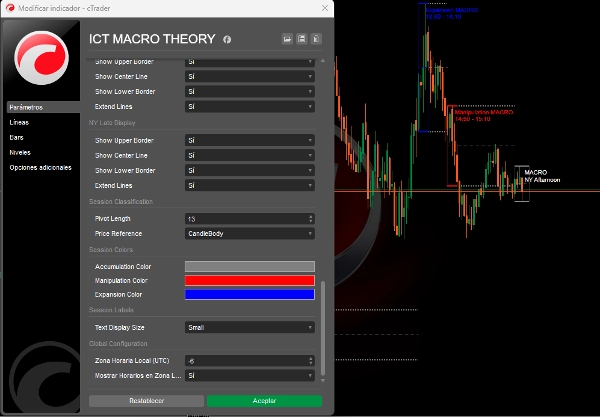
🌐 TEORIA MACRO ICT
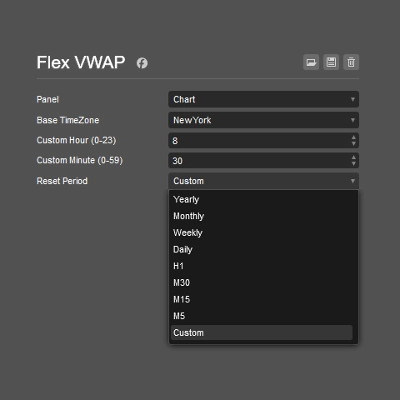
⚠️ NOTA IMPORTANTE: Este indicador funciona apenas em timeframes abaixo de 5 minutos.
Explicação dos Períodos Macro ICT
Os períodos macro ICT são essencialmente intervalos curtos durante os quais o algoritmo busca liquidez ou ajusta o preço para gaps de valor justo. A base desses macros ICT está na teoria de tempo e preço do ICT.
Um macro é "uma curta série de instruções que cria um evento na entrega do preço", conforme definido pelo próprio ICT.
Macros ICT não são estratégias de negociação completas, mas podem adicionar confluência às suas operações e maximizar lucros. Eles ocorrem durante as sessões de Londres, Nova York, meio-dia e tarde.
🔮 Implementação Avançada da Teoria dos Tempos Macro ICT:
Conexão Direta com os Conceitos ICT:
O código implementa exatamente os 3 tipos de macros ICT descritos na teoria, usando lógica de classificação baseada em:
- Análise da Estrutura de Mercado:
-
- Detecção de Sessões Macro
- Registra horários exatos do ICT (Londres 02:33, NY 09:50, etc.).
- Detecta mudanças estruturais antes e durante cada sessão macro.
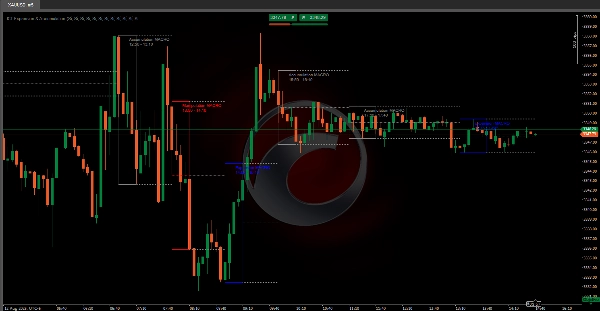
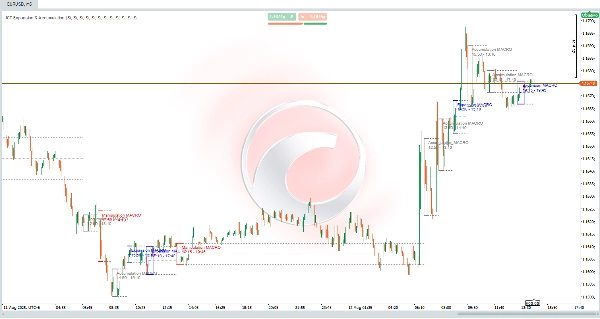
- Classifica automaticamente em:
-
- 🟥 Manipulação: Quando o preço varre a liquidez em ambos os lados (compra/venda).
- 🟦 Expansão: Movimentos direcionais que capturam liquidez de um lado (alinhados com a tendência).
- 🟩 Acumulação: Faixa estreita onde o preço "acumula" liquidez.
- Níveis-Chave Estendidos:
-
- Desenha máximas/mínimas de cada sessão macro.
- Calcula e estende o preço médio (ponto médio) para a próxima sessão.
- Esses níveis atuam como suporte/resistência dinâmicos (Essencial no ICT!).
- Detecção de Liquidez em Tempo Real:
-
- Usa dados de 1 minuto para identificar pivôs exatos (mesmo visto em timeframes inferiores).
Melhorias e Atualizações Futuras:
- Detecção de Varreduras de Liquidez: Identificará varreduras de liquidez anteriores (máximas/mínimas do dia/semana anterior).
- Gaps de Valor Justo (FVG): Detectará e visualizará gaps de valor justo.
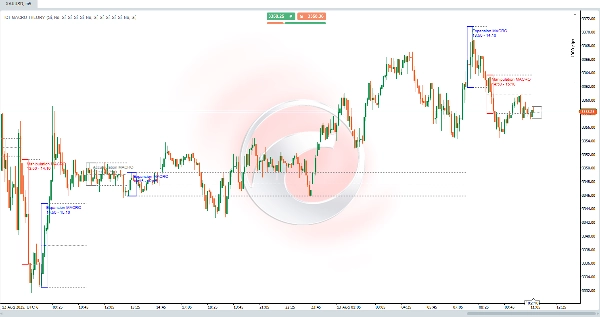
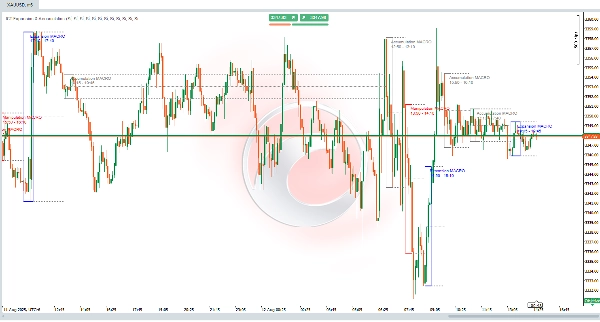
📊 Exemplo Prático ICT
Cenário de Abertura de NY (09:50-10:10):
- Pré-sessão: O preço varre a liquidez do lado da compra (mínima local).
- Durante a sessão:
-
- Classificado como 🟥 MANIPULAÇÃO.
- O preço muda para estrutura baixista.
- Pós-sessão:
-
- Linhas estendidas marcam resistência nas máximas da sessão.
- Rejeição de trade na zona com RR 1:3.
✅ Fiel ao Princípio ICT:
"Macros não são estratégias completas, mas adicionam confluência ao identificar onde os algoritmos buscarão liquidez."
Resumo
The indicator analyzes market structure and detects key macro sessions—London, New York, midday, and afternoon—recording exact ICT times. It classifies price behavior into three types of macros: Manipulation (price sweeps liquidity on both sides), Expansion (directional movement aligned with trend), and Accumulation (tight range where price accumulates liquidity). It also draws and extends session highs, lows, and average price levels to act as dynamic support and resistance.
Using 1-minute data, ICT MACRO THEORY detects precise pivots for real-time liquidity identification. While not a complete trading strategy, it adds confluence to trades by highlighting where algorithms seek liquidity. Planned updates include detection of liquidity sweeps and visualization of fair value gaps.
This tool is intended for traders seeking to incorporate ICT macro time concepts into their analysis for enhanced market structure insight and liquidity detection on very short timeframes.


![Logótipo de "[Hamster-Coder] Moving Average"](https://cdn.ctrader.com/image/webp/1bd952ad-57d2-4db2-9b49-b01be0b048b8_30113)