
Descrição
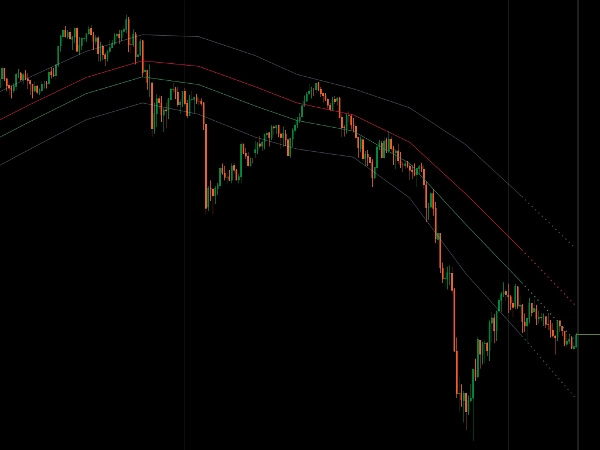
Canal de preço dinâmico usando médias móveis em todos os quatro preços OHLC para análise completa da estrutura do mercado.
Aplica o tipo de MM escolhido (Simples, Exponencial, Wilder, Escalonada por Desvio, SuperSmoother, Hull) aos limites Alto/Baixo, viés direcional de Abertura/Fechamento e linha de equilíbrio Mediana para visualização coesa do canal.
Zonas de reversão Fibonacci integradas (38,2%, 61,8%), camada dupla de suavização para SMA/EMA criando canais ultra-limpos, exibição em múltiplos períodos com modos tradicionais de degraus ou linhas de tendência diagonais, projeções inteligentes baseadas em momentum e detecção de rejeição de limites fornecem estrutura abrangente do canal para traders que buscam reversão à média e avaliação da força da tendência em vários períodos.
RECURSOS
Estrutura Completa de Preço
- Alto/Baixo definem os limites do canal
- Abertura/Fechamento mostram o viés direcional
- Linha mediana: nível de 50% entre Alto/Baixo — o verdadeiro centro do equilíbrio do mercado
- Quatro preços trabalhando juntos para mostrar a imagem completa do mercado
Zonas de Reversão Integradas
- Níveis Fibonacci 38,2% e 61,8% marcam áreas de retração estatisticamente significativas
- Zonas dinâmicas que se adaptam ao movimento do preço
- Pontos claros de referência para entrada e saída
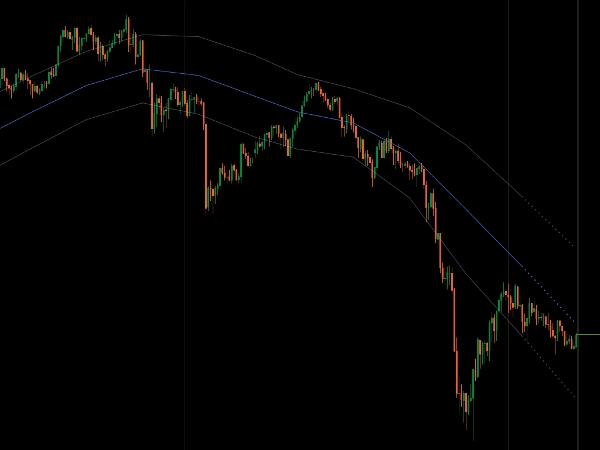
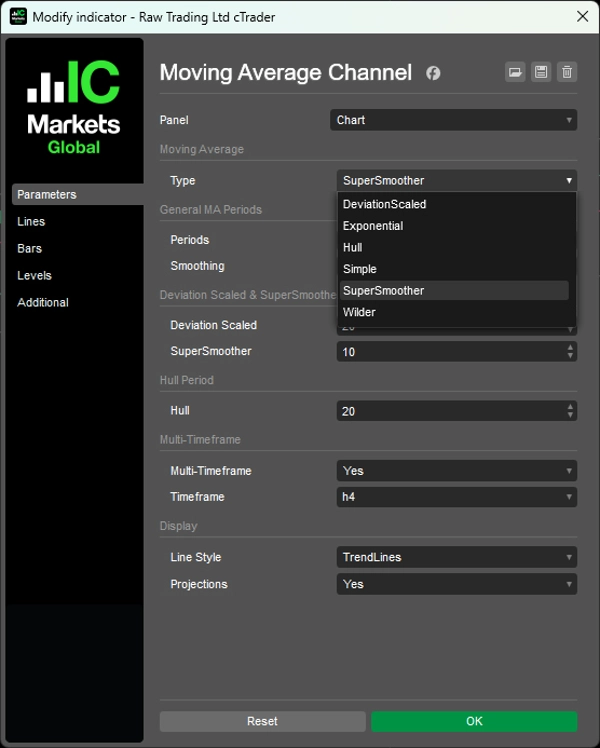
6 Tipos de Médias Móveis
- Simples, Exponencial, Wilder, Escalonada por Desvio, SuperSmoother, Hull
- Dupla suavização para SMA/EMA: Período + camada adicional de suavização para canais ultra-limpos
- Algoritmos avançados: Escalonada por Desvio adapta-se à volatilidade, SuperSmoother remove o atraso, Hull enfatiza a ação recente do preço
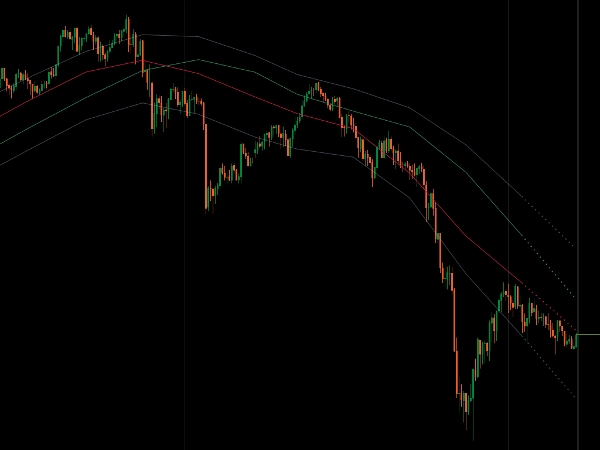
Multi-Período com Linhas de Tendência
- Visualize o canal de período superior em gráficos de período inferior
- Dois modos de exibição: linhas tradicionais em degraus ou linhas de tendência diagonais (apenas MTF)
- Linhas conectam fechamentos de barras MTF para estrutura diagonal limpa
- Projeções inteligentes mostram para onde o canal está indo com base no momentum atual
Sistema Visual Limpo
- Inclinação do canal mostra o momentum
- Posição do preço mostra a força da tendência
- Rejeições de limites sinalizam potenciais reversões
- Um indicador para análise completa da estrutura do mercado
__________________________________________________________________________________________
MAIS INDICADORES GRATUITOS
Explore uma ampla gama de ferramentas de análise de mercado — desde estrutura e volume até regressão, volatilidade e períodos personalizados.
O código-fonte está disponível no repositório GitHub.
Todos gratuitos para uso. Mas se quiser enviar um suporte para café, você pode fazer isso aqui.
Suporte/Resistência
Volume
- Perfilador de Atividade de Volume
- Analisador de Eficiência de Volume
- Análise de Perfil de Volume
- Perfil de Volume - Atualizado
- Análise de Spread de Volume
- VWAP (Preço Médio Ponderado por Volume)
Médias Móveis
- Canal SSL
- Média Móvel Ancorada
- Média Móvel Escalonada por Desvio
- Ativador Gann High Low
- Linha de Tendência Instantânea
- Média Móvel Adaptativa Kaufman com Visão de Tendência
- Canal de Média Móvel
- Conjunto de Médias Móveis
- Média Móvel de Canal de Tendência
Utilitários/Personalizados
Baseado em Regressão
Volatilidade
Osciladores
__________________________________________________________________________________________
ISENÇÃO DE RESPONSABILIDADE
Negociar envolve riscos. Este indicador é destinado apenas para análise técnica — sempre aplique gestão de risco adequada e negocie com responsabilidade.
FEEDBACK E MELHORIAS
Se você tiver sugestões, pedidos de recursos ou ideias para aprimoramento, por favor deixe um comentário na aba Discussão. Seu feedback ajuda a melhorar o indicador para todos.
Resumo
The indicator incorporates built-in Fibonacci reversion zones at 38.2% and 61.8%, which dynamically adjust with price movement to highlight significant pullback areas and provide clear entry and exit reference points. It supports multi-timeframe analysis, allowing higher timeframe channels to be displayed on lower timeframe charts, with two visualization modes: traditional stairstep lines or diagonal trendlines connecting multi-timeframe bar closes. Smart momentum-based projections indicate potential channel direction, while boundary rejection detection signals possible reversals.
This tool offers a cohesive visual system where channel slope reflects momentum and price position indicates trend strength, enabling traders to assess trend direction, momentum shifts, and mean reversion zones across various markets including Forex, Indices, Commodities, Crypto, and Stocks.


