Descrição
VISÃO GERAL
O indicador Balance of Power mede a força dos compradores versus vendedores avaliando a capacidade de cada lado de empurrar os preços para níveis extremos.
Introduzido por Igor Levshin na edição de agosto de 2001 da Technical Analysis of Stocks & Commodities, o BOP calcula a proporção do movimento de preço dentro da faixa de cada barra para revelar dinâmicas internas de força independentes da direção do preço.
CONCEITO
O Balance of Power mede onde o preço fecha dentro da faixa de cada barra para revelar a batalha interna entre compradores e vendedores.
O princípio subjacente é simples: compradores empurram os preços para o topo, vendedores para o fundo. Onde o preço fecha dentro dessa faixa revela quem dominou o período de negociação.
Os valores brutos são suavizados usando uma média móvel para reduzir o ruído e revelar pressão direcional sustentada, transformando leituras erráticas barra a barra em um indicador limpo de momentum que acompanha mudanças no controle do mercado.
APLICAÇÃO NA ESTRUTURA DE MERCADO
O BOP fornece análise de força interna que pode confirmar ou contradizer a estrutura de preço:
Identificação da Fase da Tendência
- Tendência de alta forte: BOP consistentemente acima de zero com mínimas mais altas
- Tendência de baixa forte: BOP consistentemente abaixo de zero com máximas mais baixas
- Consolidação: BOP oscilando em torno da linha zero
- Zonas de transição: BOP rompendo a estrutura anterior (máxima mais alta/mínima mais baixa)
Confluência de Suporte/Resistência
- O retorno do BOP para zero frequentemente coincide com o teste de níveis-chave pelo preço
- Leituras extremas do BOP (+0,8 a +1,0 ou -0,8 a -1,0) podem indicar exaustão próxima à estrutura
- Divergência em níveis de estrutura sugere potencial rejeição ou rompimento
Distribuição/Acumulação
- Preços subindo com BOP em queda: potencial fase de distribuição
- Preços caindo com BOP subindo: potencial fase de acumulação
- Essas divergências são mais significativas próximas a níveis importantes de estrutura
ESTRATÉGIA MULTI-TIMEFRAME
Usar o BOP em diferentes timeframes oferece contexto e precisão:
1. Timeframe Superior (HTF) - Viés Direcional:
- BOP diário/4H acima de zero → buscar oportunidades de compra em timeframes inferiores
- BOP diário/4H abaixo de zero → buscar oportunidades de venda em timeframes inferiores
- BOP HTF cruzando zero → mudança importante de tendência, aguardar confirmação
2. Timeframe Inferior (LTF) - Tempo de Entrada:
- BOP 1H/15M alinhado com HTF → setups de alta probabilidade
- Crossover BOP/Sinal no LTF na direção do HTF → gatilho de entrada
- Expansão do histograma LTF confirma momentum
3. Alinhamento de Timeframes:
- Todos os timeframes em concordância → trades com maior convicção
- HTF e LTF divergindo → aguardar resolução ou evitar trade
- Reversão LTF contra HTF → scalp potencial contra-tendência apenas
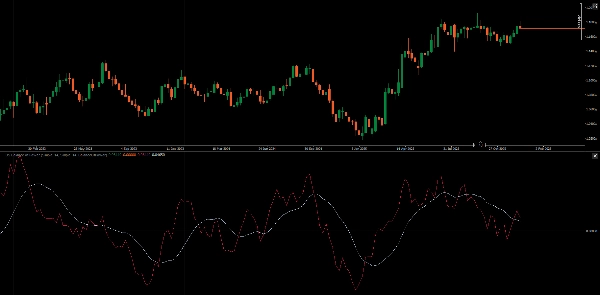
LINHA DE SINAL & HISTOGRAMA
Linha de Sinal (MA do BOP):
- Crossover BOP/Sinal fornecem sinais filtrados de entrada/saída
- Inclinação da linha de sinal indica persistência do momentum
- Distância entre BOP e Sinal mostra extensão do movimento
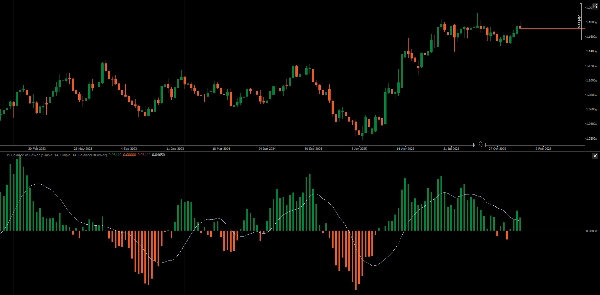
Modos do Histograma:
- Modo Valor: Mostra polaridade do BOP relativa a zero (domínio comprador/vendedor)
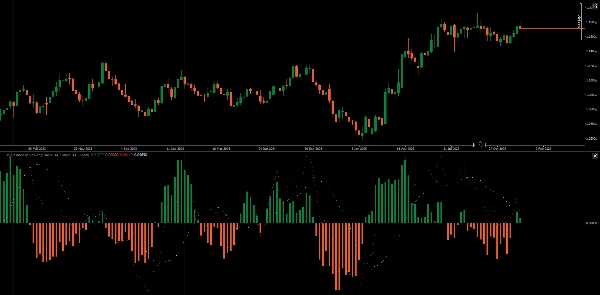
- Modo Sinal: Mostra a diferença BOP - Sinal, revelando mudanças de momentum antes dos crossovers
No modo Sinal, os crossovers da linha zero do histograma ocorrem antes dos crossovers da linha BOP/Sinal, oferecendo aviso antecipado de mudança de momentum.
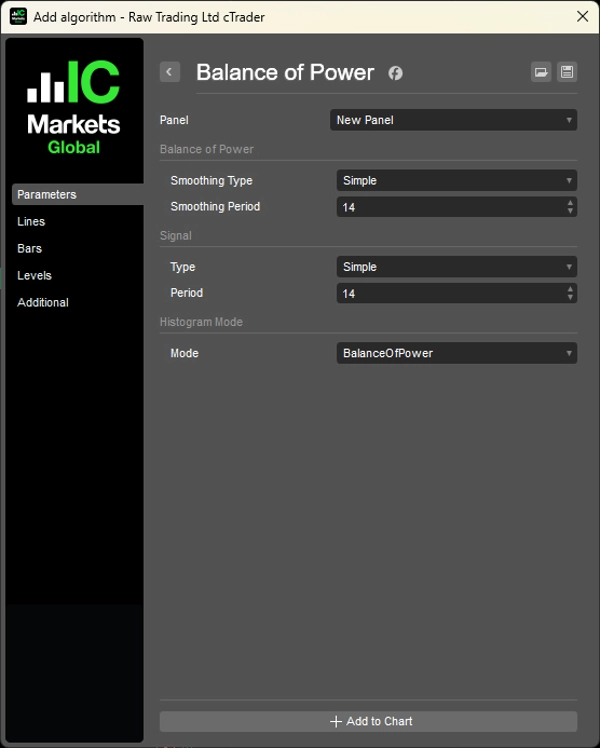
CARACTERÍSTICAS
- Período de Suavização: Período MA ajustável para BOP (padrão 14)
- Tipo de Suavização: Escolha de tipos de MA (SMA, EMA, etc.)
- Período de Sinal: Período MA ajustável para linha de Sinal (padrão 14)
- Tipo de Sinal: Escolha de tipos de MA para linha de Sinal
- Modo do Histograma: Alternar entre exibição de Valor e diferença de Sinal
EXEMPLO PRÁTICO
- HTF (Diário): BOP acima de zero e subindo → viés de alta
- Preço recua para suporte
- LTF (1H): BOP cruza acima do Sinal → gatilho de entrada
- Histograma (modo Sinal) expande → confirma aceleração do momentum
- Saída quando o histograma LTF contrai ou BOP cruza abaixo do Sinal
__________________________________________________________________________________________
MAIS INDICADORES GRATUITOS
Explore uma ampla gama de ferramentas de análise de mercado — desde estrutura e volume até regressão, volatilidade e timeframes personalizados.
O código-fonte está disponível no repositório do GitHub repository.
Todos gratuitos para uso. Mas se quiser enviar um suporte para café, pode fazê-lo aqui.
Suporte/Resistência
Volume
- Volume Activity Profiler
- Volume Efficiency Analyzer
- Volume Profile Analytics
- Volume Profile - Updated
- Volume Spread Analysis
- VWAP (Volume Weighted Average Price)
Médias Móveis
- SSL Channel
- Anchored Moving Average
- Deviation-Scaled Moving Average
- Gann High Low Activator
- Instantaneous Trendline
- Kaufman Adaptive MA with Trend Vision
- Moving Average Channel
- Moving Averages Suite
- Trend Channel Moving Average
Utilitários/Personalizados
Baseado em Regressão
Volatilidade
Osciladores
__________________________________________________________________________________________
ISENÇÃO DE RESPONSABILIDADE
Negociar envolve riscos. Este indicador é destinado apenas para análise técnica — sempre aplique gerenciamento de risco adequado e negocie com responsabilidade.
FEEDBACK & MELHORIAS
Se você tiver sugestões, pedidos de recursos ou ideias para aprimoramento, por favor deixe um comentário na aba Discussão. Seu feedback ajuda a melhorar o indicador para todos.
Resumo
Key functionalities include identifying trend phases—strong uptrends, downtrends, consolidation, and transition zones—by observing BOP behavior relative to the zero line. It also aids in detecting support and resistance confluence, with extreme BOP readings indicating potential exhaustion near key levels and divergences signaling possible rejections or breakthroughs. The indicator helps identify distribution and accumulation phases through price and BOP divergences.
BOP supports multi-timeframe analysis: higher timeframes provide directional bias, while lower timeframes offer entry timing signals via BOP and signal line crossovers and histogram momentum confirmation. The signal line is a moving average of BOP, with crossovers serving as filtered entry/exit triggers. The histogram can display either BOP polarity or the difference between BOP and its signal line, offering early momentum shift warnings.
Adjustable parameters include smoothing periods and types for both BOP and signal lines, and histogram display modes. The indicator is applicable across Forex, indices, commodities, cryptocurrencies, and stocks markets.