
🚀 เทรดเดอร์กว่า 10,000 คนใช้ตัวชี้วัด TOP ของเราแล้ว 🏆 …และชุมชนยังคงเติบโต!
ค้นพบว่าทำไมมืออาชีพถึงเลือกเรา – เครื่องมือที่ทรงพลังที่สุดของ cTrader (ตัวชี้วัด + อัลกอริทึม + cBots) กำลังรอคุณอยู่
👉 รับระบบ TOP ทั้งหมดของเราที่นี่:
ตัวชี้วัดร้าน Pinescriptlabs: cBots ร้าน Pinescriptlabs : (cBot) Gold & BTC BreakoutSession Pivots(ใหม่)
โครงสร้างตลาดขั้นสูง: Bos, Choch, SwinLevels, Order Blocks, Market Structure & Liquidity Finder (ใหม่)
การพยากรณ์สภาพคล่องราคา ZigZag
อัลกอริทึมสมาร์ทติดตาม (ใหม่)
SmartTrend Support &
Resistance
Lines
การวิเคราะห์
โครงสร้างตลาด
แบบไดนามิก
ของ
จุดกลับตัว
Points
ฟีโบนัชชี
การถดถอยเชิงเส้น
หลายกรอบเวลา
Multi-timeframe
ช่องว่างมูลค่ายุติธรรมโมเมนตัม
ตัวติดตาม
แนวเทียนหลายระดับ
Candle Bias
แนวรับและ
แนวต้านอัตโนมัติ
แนวโน้ม
Lines
ระดับ
แนวรับและ
แนวต้านทั้งหมด
Levels
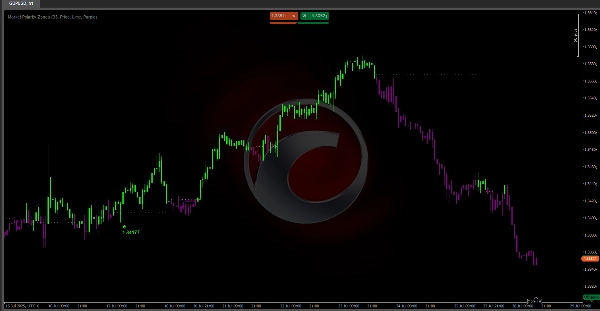
โซนขั้วตลาด 📊
อัลกอริทึมนี้ทำอะไร?
โซนขั้วตลาด เป็นตัวชี้วัดขั้นสูงที่ช่วยให้ง่ายต่อการวิเคราะห์ตลาดโดยการระบุอัตโนมัติ ช่วงขาขึ้น 🚀 หรือขาลง 🐻 และทำเครื่องหมายระดับสำคัญที่มีแนวโน้มจะเกิดการกลับตัวของแนวโน้ม
เหมาะสำหรับ:
- เทรดเดอร์ที่ใช้การเคลื่อนไหวของราคา
- เทรดเดอร์สวิง
- สแคปเปอร์,...ที่ต้องการมองเห็น ทิศทางตลาด และ จุดเข้า/ออกที่แม่นยำ.
ตรรกะทำงานอย่างไร?
อัลกอริทึมใช้ ค่าเฉลี่ยเคลื่อนที่ Hull สองเส้น (HMA) ที่มีช่วงเวลาต่างกันเพื่อตรวจจับการเปลี่ยนแปลงโมเมนตัมและตั้งค่าระดับไดนามิกดังนี้:
- ตรวจจับการตัดกันของ HMA เพื่อระบุการเปลี่ยนแปลงแนวโน้ม
- ตั้งค่าระดับอัตโนมัติ:
-
- การตัดกันขาขึ้น → ทำเครื่องหมายจุดต่ำสุดเป็น ระดับแนวรับ
- การตัดกันขาลง → ทำเครื่องหมายจุดสูงสุดเป็น ระดับแนวต้าน
- รักษาระดับที่ใช้งานอยู่ จนกว่าจะเกิดการตัดกันใหม่
สิ่งที่คุณจะเห็นบนชาร์ตของคุณ:
🎨 ระบบสีที่เข้าใจง่าย:
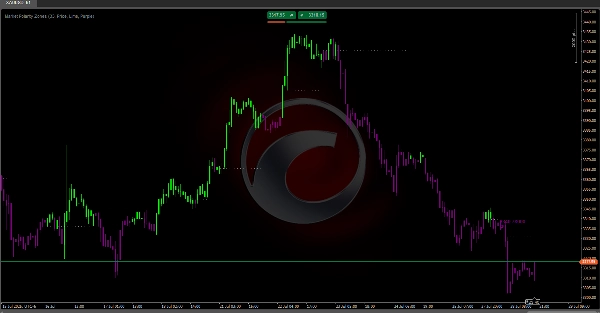
- แท่งเทียนสีเขียว 🟢: ราคาสูงกว่าระดับ (โซนขาขึ้น – มองหาการซื้อ)
- แท่งเทียนสีม่วง 🟣: ราคาต่ำกว่าระดับ (โซนขาลง – มองหาการขาย)
📉 เส้นระดับไดนามิก:
- เส้นประแนวนอน ทำเครื่องหมายระดับขั้วที่ใช้งานอยู่
- ขยายโดยอัตโนมัติ ตราบใดที่ระดับยังคงมีผล
- แสดงเฉพาะ เมื่อระดับมีความมั่นคง
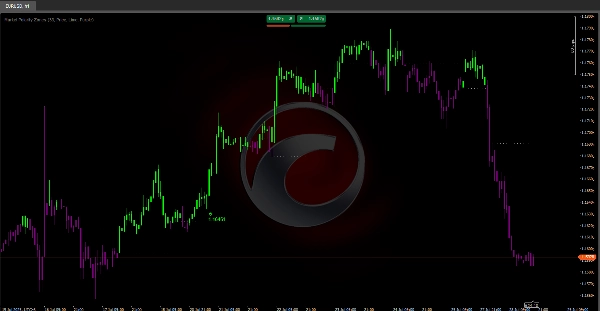
⚠️ การแจ้งเตือนการกลับตัว:
ป้ายลูกศรจะปรากฏเมื่อเกิดรูปแบบเฉพาะ:
- 🔻 การกลับตัวขาลง (ป้ายสีม่วง):
-
- รูปแบบ: ราคาขึ้น → ล้มเหลว → ลดลงต่ำกว่าระดับ
- ความหมาย: แรงกดดันขาขึ้นอ่อนตัวลง อาจเปลี่ยนไปสู่ โซนขาลง
- 🔺 การกลับตัวขาขึ้น (ป้ายสีเขียว):
-
- รูปแบบ: ราคาลดลง → เด้งขึ้น → สูงกว่าระดับ
- ความหมาย: ผู้ซื้อปกป้องระดับ อาจเปลี่ยนไปสู่ โซนขาขึ้น
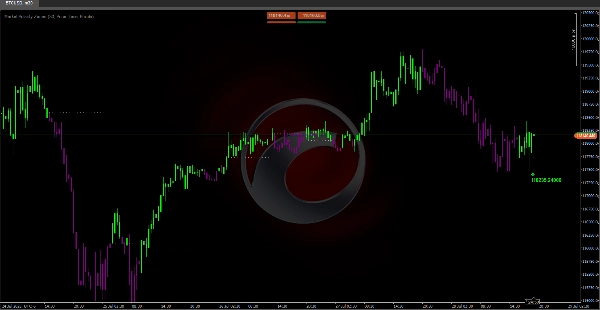
ℹ️ ข้อมูลป้าย:
- "ราคา": แสดง จุดที่การเบรกเอาต์ล้มเหลวอย่างแม่นยำ – ใช้สำหรับตั้งจุดหยุดที่แม่นยำหรือระบุแนวต้าน/แนวรับสำคัญ
- "ปริมาณ": ผลรวมของปริมาณ 3 แท่งล่าสุด – ยืนยันว่าการกลับตัวมี การมีส่วนร่วมของตลาดจริง.
การตั้งค่าที่แนะนำ:
- ความยาว: 33 (ค่าเริ่มต้น) – ใช้งานได้ดีในตลาดส่วนใหญ่
- ข้อมูลป้าย: "ราคา" สำหรับความแม่นยำระดับ, "ปริมาณ" สำหรับการยืนยัน
- สี: ใช้สีมะนาว/ม่วงเพื่อความคอนทราสต์ที่ดีที่สุด 🎨


