Penerangan
Penerangan
Penunjuk Kedai Pinescriptlabs: 🤖 Pinescriptlabs Kedai cBots : (cBot)
Pecahan Emas & BTCPivot Sesi(baru)
Sokongan &
Rintangan SmartTrend
Garis
Dinamik
Struktur Pasaran
Analisis
dari
Titik Pusing
Fibonacci
Linear
Regresi
Berbilang jangka masa
Berbilang Tahap
Bias Lilin
Penjejak
Auto
Sokongan dan
Rintangan
Trend
Garis
Semua
Sokongan dan
Rintangan
Tahap
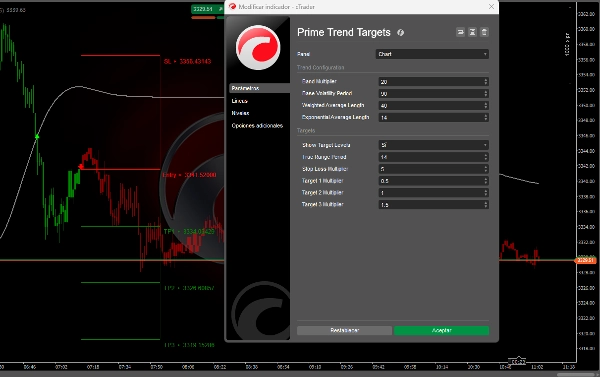
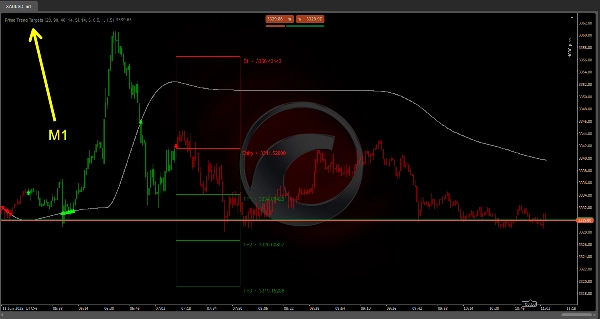
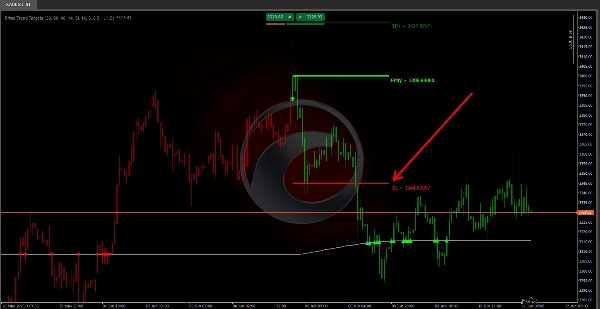
Sasaran Trend Utama :
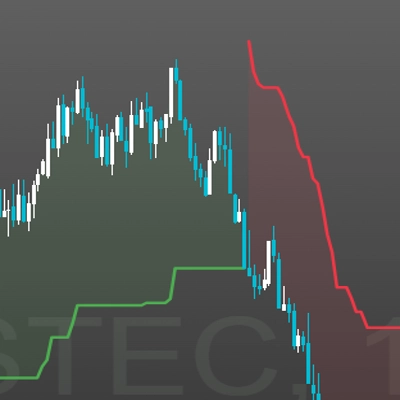
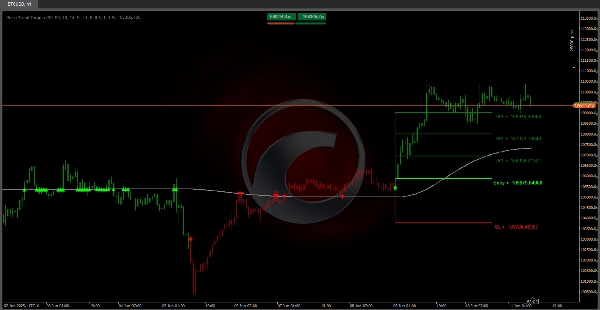
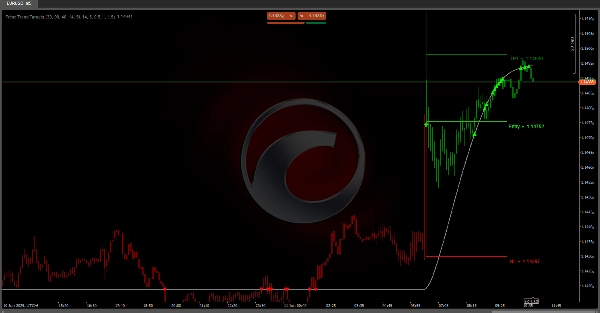
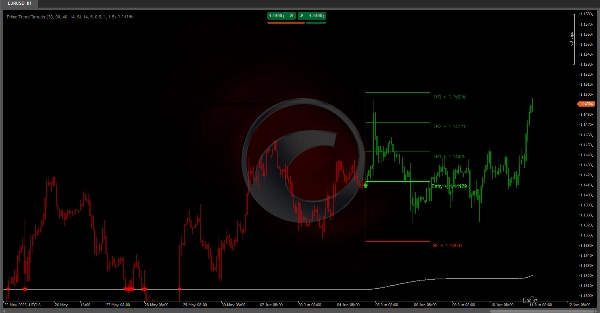
menawarkan garis trend yang dilicinkan berdasarkan jalur volatiliti (ATR) dengan logik ketekalan, menapis bunyi kecil. 🔄 Ia mengesan pembalikan trend dengan membandingkan nilai semasa garis dengan nilai sebelumnya dan mengesahkan isyarat melalui kiraan penolakan apabila harga berulang kali menguji garis tersebut. ✅ Setelah peralihan fasa disahkan, ia meramalkan kemasukan, henti rugi, dan sehingga tiga sasaran yang disesuaikan dengan volatiliti (ATR × pengganda), melukis tahap risiko/ganjaran dan zon pada carta. 🎨 Lilin diwarnakan mengikut fasa untuk bacaan mudah.
⚙️ Impak Parameter
• Sensitiviti lebih tinggi vs. ketahanan:
- 📉 Tempoh ATR & pelicinan lebih pendek bertindak balas lebih cepat kepada pembalikan tetapi menghasilkan lebih banyak bunyi.
- 📊 Tempoh lebih panjang melicinkan isyarat palsu tetapi mungkin melambatkan pengesanan.
- 🔍 Pengganda lebih besar memperlebar jalur & henti, mengurangkan isyarat pramatang tetapi meningkatkan kelewatan atau kerugian jika pembalikan yang dijangka gagal.
- 🎯 Sasaran lebih kecil mengunci keuntungan sederhana dengan cepat; sasaran lebih besar menargetkan pergerakan lanjutan tetapi dengan kebarangkalian kena yang lebih rendah.
• Pelarasan holistik: Gabungkan tetapan volatiliti, jalur, pelicinan, dan pengurusan tahap untuk aset & jangka masa anda.
✅Garis Panduan Operasi
• Uji semula & ujian demo dengan teliti—cuba gabungan berbeza dalam keadaan berbeza (trend, julat, volatiliti tinggi/rendah).
• Gabungkan dengan analisis lain: Sokongan/rintangan, corak lilin, isipadu, atau penunjuk pengesahan.
• Pengurusan risiko: Saiz posisi berdasarkan jarak henti untuk mengekalkan peratusan risiko tetap.
• Disiplin & semakan berkala: Elakkan pengoptimuman berlebihan untuk data lalu; laraskan apabila keadaan pasaran berubah.
Ringkasan
Ulasan pelanggan
5 | 0 % | |
4 | 100 % | |
3 | 0 % | |
2 | 0 % | |
1 | 0 % |


![Logo "[Stellar Strategies] Smart ADX"](https://cdn.ctrader.com/image/webp/af13b084-b6f6-41db-b7bc-c7e688b57b05_36929)