
Açıklama
Pinescriptlabs Store göstergeleri: Pinescriptlabs Store cBotları : (cBot) Gold & BTC BreakoutOturum Pivotları(yeni)
FİYAT HAREKETİ (Yeni)
Takip Eden Akıllı Algoritma (yeni)
SmartTrend Destek &
Direnç
Çizgileri
Dinamik
Piyasa Yapısı
Analizi
Dönüş
Noktalarının
Analizi
Fibonacci
Doğrusal
Regresyon
Çok Zamanlı
Çok Seviyeli
Mum Yönü
Takipçisi
Otomatik
Destek ve
Direnç
Trend
Çizgileri
Tüm
Destek ve
Direnç
Seviyeleri
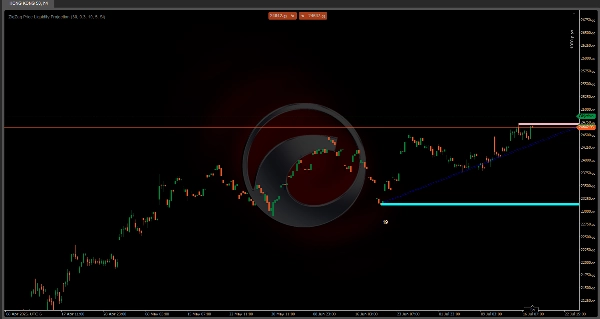
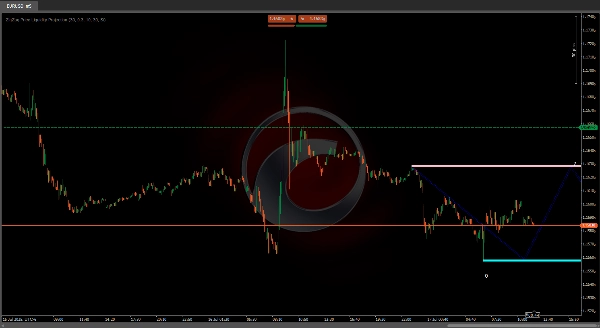
📊 ZigZag Fiyat Likidite Projeksiyon Göstergesi
"Piyasanın nerede dönebileceğini önceden görün!" 🔮
Bu gösterge ana destek/direnç seviyelerini 🛑 belirler ve likidite bölgelerini tahmin eder 💧 grafiğinizde şu yöntemlerle:
- 🔍 Pivot Noktaları: Önemli yüksek ve düşükleri tespit eder
- 📈 ATR Volatilitesi: Hassas ayar için fiyat dalgalanmalarını ölçer
- 💦 Likidite Projeksiyonları: Zigzag desenleriyle yüksek aktivite alanlarını (alım/satım kümeleri) öngörür
🎯 Amaç: Giriş/çıkış kararlarını iyileştirmek için fiyat tepki bölgelerini (sekme/kırılma/konsolidasyon) tahmin eder
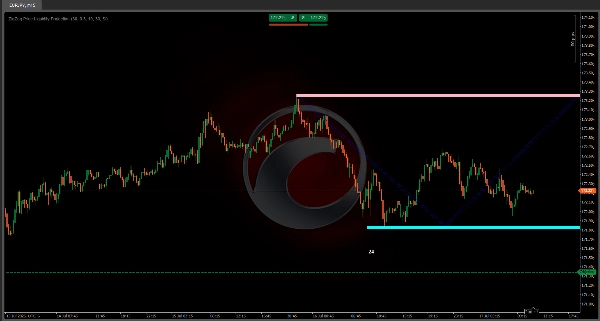
✨ Zigzag Avantajı
Bu bağlı çizgiler bir hazine haritası 🗺️ gibi davranır ve şunları gösterir:
1️⃣ Tanımlı aralıklarda gelecekteki fiyat yollarını
2️⃣ Fiyatın duraklayabileceği veya dönebileceği potansiyel dönüş bölgelerini
3️⃣ Ticaret planlaması için görsel referans noktalarını
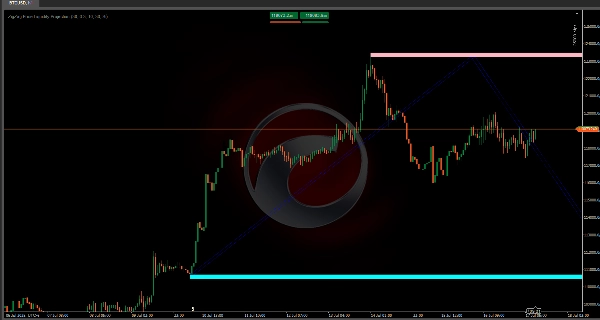
🚦 Temel Özellikler:
- 📅 Önemli seviyeler için erken uyarı sistemi
- 🎯 Pivot yapıları baz alınarak gelecekteki hareketleri projeler (boğa/ayı yolları)
- 🔢 Dokunma sayacı (örneğin, "24" = o seviyede 24 tarihsel test)
⚙️ Önerilen Ayarlar
AyarDeğerEtkisi
ATR Periyodu
30
🎚️ Volatilite hassasiyeti
Pivot Periyodu
30
🔍 Pivot önem aralığı
⏳ En İyi Zaman Dilimleri: 15dk - 4sa grafikler ⏱️
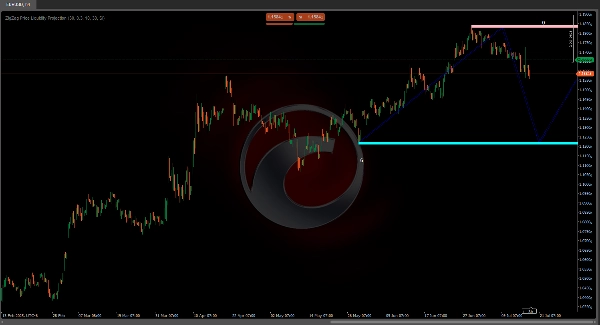
💡 Profesyonel İpucu:
"Onay için mum formasyonları 🕯️ ile birleştirin! Zigzag fiyatın NEREYE gidebileceğini gösterir, mumlar NE ZAMAN olduğunu gösterir."
🎯 Sonuç:
Güçlü bir hepsi bir arada görsel araç şunları tespit etmek için:
✅ Likidite bölgeleri 💦
✅ Kritik seviyeler 🎯
✅ Gelecekteki fiyat yolları 🚀
Hareketleri kovalamak yerine önceden tahmin etmek isteyen gün içi traderlar için mükemmel! 🏃💨


