Açıklama
Pinescriptlabs Store göstergeleri: Pinescriptlabs Store cBotları : (cBot) Gold & BTC BreakoutOturum Pivotları(yeni)
Gelişmiş Piyasa Yapısı: Bos, Choch, SwinLevels, Emir Blokları, Piyasa Yapısı & Likidite Bulucu (Yeni)
ZigZag Fiyat Likidite Projeksiyonu
Akıllı Takip Algoritması (yeni)
AkıllıTrend Destek &
Direnç
Çizgileri
Dinamik
Piyasa Yapısı
Analizi
Dönüş
Noktaları
Fibonacci
Doğrusal
Regresyon
Çok Zamanlı
Çok Katmanlı
Mum Eğilimi
Takipçisi
Otomatik
Destek ve
Direnç
Trend
Çizgileri
Tüm
Destek ve
Direnç
Düzeyleri
📊 Piyasa Akışı Projeksiyonu:
FutureTrend göstergesi, fiyat ve hacim verilerini çoklu zaman boyutlarında entegre ederek piyasa davranışını dinamik olarak analiz etmek ve projekte etmek için tasarlanmıştır. Temel işlevleri şunlardır:
⏳ Üç Dönem Analizi
📈 Üç ardışık dönemde ortalama fiyatları (yüksek ve düşük) ve delta hacmini (alış ve satış baskısı farkı) Period parametresi ile hesaplar.
🔍 Bu konsolide geçmiş hareket görünümü, baskın trendleri ve piyasa davranışındaki değişimleri belirlemeye yardımcı olur.
🚀 Gelecek Trend Çizgisi Projeksiyonu
📊 Üç analiz edilen dönemin delta hacimlerinin ağırlıklı ortalamasını kullanarak, gösterge piyasanın olası yönünü yansıtan bir gelecek trend çizgisi projekte eder.
🛠️ Projeksiyon, aşırı tahminlerden kaçınmak için yumuşatma faktörleriyle dinamik olarak ayarlanır.
🔷 Şekillerin Görsel Temsili
🎨 Tarihsel veriler, her dönem için hacim ve fiyat aralıklarının evrimini gösteren geometrik şekiller (üçgenler, daireler veya kutular) ile görsel olarak temsil edilir.
🔴🟢 Atanan renkler (UpColor ve DownColor) hakim trendi (boğa veya ayı) gösterir ve hızlı yorumlamayı sağlar.
🏷️ Ortalama Delta Hacmi & Gelecek Fiyat Etiketi
📍 Projeksiyon trend çizgisinin sonunda, ortalama delta hacmini ve tahmini gelecek fiyatı gösteren bir etiket bulunur; bu, potansiyel fiyat hareketleri ve trend gücü için önemli bir referans sunar.
📋 Hacim Veri Tablosu
📑 Üç analiz edilen dönemin toplam hacimlerini ve delta farklarını detaylandıran bir tablo sağlar.
📊 Bu, yatırımcıların hacim verilerini hızlıca karşılaştırmasına, piyasa bağlamını yorumlamasına ve gelecek trend projeksiyonunu desteklemesine olanak tanır.
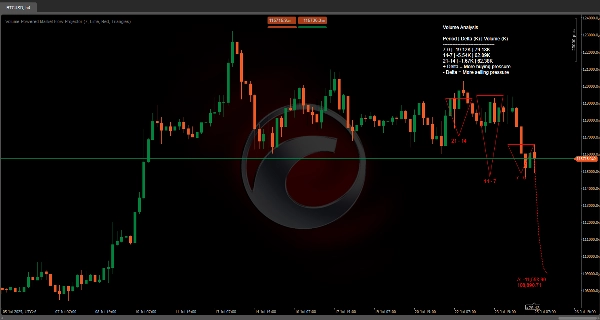
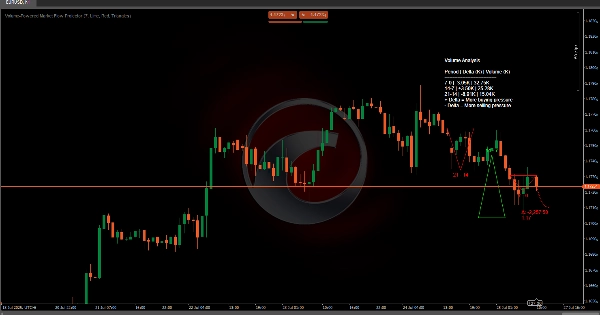
🔮 Yön
Hacim ve fiyat verilerini birleştirerek, gösterge yaklaşan dönemlerde hem trend gücünü hem de piyasa davranışındaki olası değişimleri tahmin etmek için sağlam bir araç sunar.
Özet
The indicator projects a future trendline based on a weighted average of delta volumes from the analyzed periods, dynamically adjusted with smoothing factors to prevent extreme predictions. Historical data is visually represented using geometric shapes—such as triangles, circles, or boxes—that illustrate volume and price range evolution for each period. Colors indicate prevailing trends, with distinct hues for bullish and bearish conditions.
At the end of the projected trendline, a label displays the average delta volume and estimated future price, providing a reference for potential price movements and trend strength. Additionally, a detailed volume data table breaks down total volumes and delta differences for the three periods, supporting market context interpretation and trend projection. By combining volume and price data, this tool aids in predicting trend strength and potential market behavior shifts.
Müşteri değerlendirmeleri
5 | 100 % | |
4 | 0 % | |
3 | 0 % | |
2 | 0 % | |
1 | 0 % |