
说明
🚀 超过10,000名交易者已经使用我们的顶级 指标🏆
发现专业人士为何选择我们——最强大的工具在 cTrader(指标、算法和cBots)正等着你。
👉 在这里获取我们所有的顶级系统:
_______________________________________________
📌 市场结构指标
· ✅ 高级市场结构:Bos,Choch,SwinLevels,订单区块, 市场结构& 流动性发现器
· 🔄 动态市场结构转折点分析
· 🧱 订单区块
· ⚖️ 市场失衡
· ⛓️ BOS & CHOCH
· 🧠 ICT 三力
· 🌀 市场极性区
_______________________________________________
🔚 智能退出系统
· 📍 跟踪智能算法
_______________________________________________
📐 之字形指标
· 🔍 之字形价格流动性投影
· 🧭 支撑与阻力结构之字形
· ➖ 之字形
· 🎯 之字形极端追踪器
_______________________________________________
🧱 支撑与阻力指标
· 🟩 智能趋势支撑与阻力线
· 🧱 所有支撑和阻力水平
_______________________________________________
📊 趋势与通道指标
· 🔄 自动趋势通道
· 📊 超级趋势
· ⚡动量趋势分析器
· 🧠 自适应趋势通道
· 💥 通道突破系统
· 🌈 动态趋势渐变
· ⭐ 高级SSL通道
· 🔁 反应式移动平均线
_______________________________________________
💧 成交量与流动性工具
· 🔥 成交量POC热力图
· 📉 杠杆清算图
· 🔍 动量公平价值缺口
· 🕒 公平价值缺口时段
_______________________________________________
⚡ 动量与RSI指标
· 📈 RSI趋势触发器
· 🚀 动态范围动量
· 🔎 多层蜡烛偏向
追踪器
_______________________________________________
🔮 预测与投影工具
· 📐 基于线性回归和ATR的预测
· 📏 斐波那契线性回归多时间框架
· 📈 基于成交量的市场流动投影仪
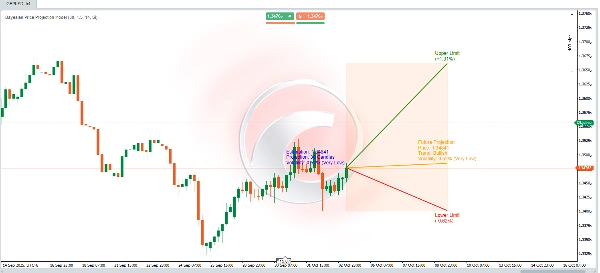
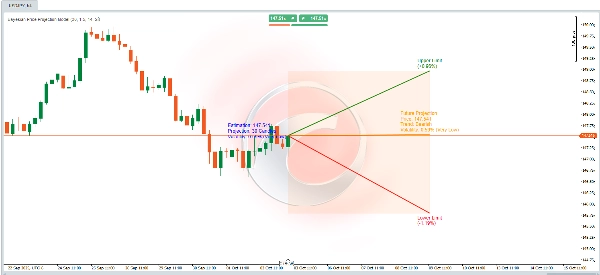
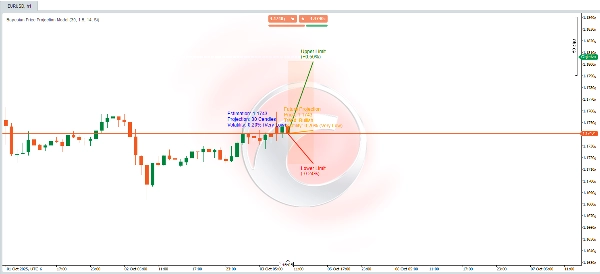
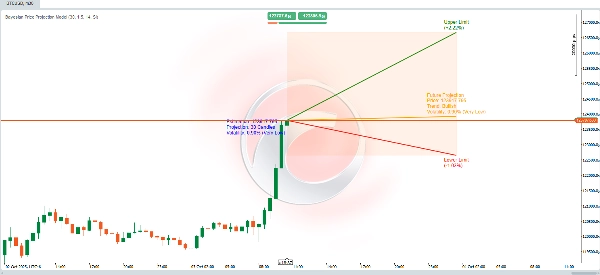
📊 动态价格投影算法 📈
该算法结合了**统计计算**、**技术分析**和**贝叶斯理论**,以预测未来价格,同时提供表示上下界限的不确定性范围。计算设计考虑了市场的**趋势**、**波动性**以及达到新高或新低的历史概率,从而调整预测。
工作原理如下:
🚀 未来价格预测
基于三个关键因素进行动态计算以估计未来价格:
1. **趋势**:定义市场倾向于上涨还是下跌。
2. **波动性**:根据历史波动量化预期变化的幅度。
🧠 **贝叶斯概率调整**
- 使用**贝叶斯公式**计算条件概率:
\[
P(A|B) = \frac{P(B|A) \cdot P(A)}{P(B)}
\]
该模型利用条件信息预测未来事件:
- 如果价格呈上升趋势,达到新历史高点的概率。
- 如果价格呈下降趋势,达到新历史低点的概率。
- 这些概率通过考虑以下因素优化未来价格估计:
- **更高的波动性**增加触及极端水平(高点/低点)的可能性。
- **市场趋势**影响预期的价格运动方向。
🌟 **波动性计算**
- 使用14周期窗口的**ATR(平均真实波幅)**指标测量波动性,反映价格波动的平均幅度。
- 为以百分比表示波动性,将ATR除以收盘价并乘以200进行归一化。
- 然后将波动性分类为描述性等级(如**非常低**、**低**、**中等**等),以便更好理解。
---
🎯 **偏差限(上限和下限)**
- 上下限形成围绕估计未来价格的**预测范围**,提供不确定性的框架。
- 这些限值通过调整ATR计算得出,调整因素包括:
- 用户定义的**乘数**(`factor_desviacion`)。
- 之前计算的**贝叶斯概率**。
- **预测周期的平方根**(`proyeccion_dias`),体现不确定性随时间增长的原理。
🔍 **模型解读**
这可以看作一个**动态概率模型**,它:
- 结合了**技术分析**(趋势和ATR)。
- 使用**贝叶斯理论**优化概率。
- 提供**可视化预测范围**,帮助您理解潜在的未来价格变动及相关不确定性。
⚡ 无论您是在分析**波动市场**还是确认**牛市/熊市情景**,该工具都为您提供了强大且数据驱动的方法!🚀


!["[Stellar Strategies] MARSI Signal Plotter" 标识](https://cdn.ctrader.com/image/webp/7b2b8da6-8f8e-4646-8d4a-4710c516c01e_25567)


