说明
🚀 超过10,000名交易者已经使用我们的顶级 指标🏆
👉 在这里获取我们所有的顶级系统:
_______________________________________________
📌 市场结构指标
· ✅ 高级市场结构:Bos,Choch,SwinLevels,订单区块, 市场结构& 流动性探测器
📊 枢轴突破检测器
· 🔄动态市场结构转折点分析
· 🧱 订单区块
· ⚖️ 市场不平衡
· ⛓️ BOS & CHOCH
· 🧠 ICT 三力
· 🌀 市场极性区域
_______________________________________________
🔚 智能退出系统
· 📍 追踪智能算法
_______________________________________________
📐 之字形指标
· 🔍 之字形价格流动性投影
· 🧭 支撑与阻力结构之字形
· ➖ 之字形
· 🎯 之字形极端追踪器
_______________________________________________
🧱 支撑与阻力指标
· 🟩 智能趋势支撑与阻力线
· 🧱 所有支撑和阻力水平
_______________________________________________
📊 趋势与通道指标
· 🔄 自动趋势通道
· 📊 超级趋势
· ⚡动量趋势分析器
· 🧠 自适应趋势通道
· 💥 通道突破系统
· 🌈 动态趋势梯度
· ⭐ 高级SSL通道
· 🔁 反应性移动平均线
_______________________________________________
💧 成交量与流动性工具
· 🔥 成交量POC热力图
· 📉 杠杆清算图
· 🔍 动量公允价值缺口
· 🕒 公允价值缺口时段
_______________________________________________
⚡ 动量与RSI指标
· 📈 RSI趋势触发器
· 🚀 动态范围动量
· 🔎 多层级蜡烛偏向
追踪器
_______________________________________________
🔮 预测与投影工具
· 📐 基于线性回归与ATR的预测
· 📏 斐波那契线性回归多时间框架
· 📈 成交量驱动的市场流动投影器
________________________________________________________________________________________
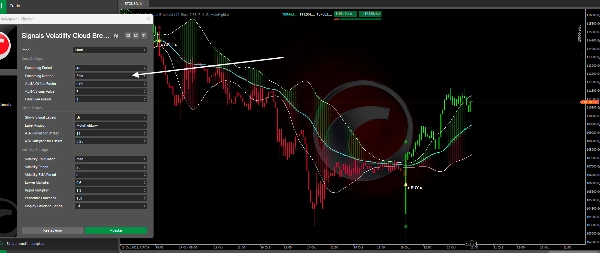
信号波动云突破.
总体概述 💡
自适应趋势带是一种先进的趋势跟踪指标,结合了自适应价格过滤和动态波动带。与传统的静态带指标不同,该系统根据市场条件的变化自动调整其灵敏度,在不同波动环境中提供更准确的信号。🎯
该指标的作用是什么? 🤔
该指标生成价格(OHLC)的过滤和平滑表示,消除市场噪音,使基础趋势更清晰地可视化。同时,它计算上下波动带,这些波动带根据当前波动性自动扩展或收缩,适应平静或动荡的市场。🌊
主要特点: ✨
- 使用ALMA或EMA算法进行自适应价格过滤
- 利用历史百分位动态调整的波动带
- 当价格穿越波动带时显示视觉买入/卖出信号 🟢🔴
- 根据检测到的趋势为蜡烛着色(绿色看涨 / 红色看跌)
- 在过滤线之间着色云层以可视化趋势强度 💪
它是如何工作的? ⚙️
过滤系统
该指标对价格应用两阶段平滑处理:
- 第一层: 使用ALMA(Arnaud Legoux移动平均)或传统EMA过滤器消除短期波动。ALMA特别有效,因为它在保持平滑的同时减少滞后。
- 第二层: 对第一层过滤结果应用额外的EMA平滑,创建一个超平滑的趋势线,能够平衡地响应价格变化。
自适应波动性计算 📏
系统使用两种方法测量市场波动性:
- 标准差(StdDev):经典的离散度测量方法
- 平均绝对偏差(MAD):对极端值更具鲁棒性
计算出的波动性经过平滑处理后,与过去波动性的历史数据进行比较,以确定其百分位排名。该百分位控制波动带的乘数:
- 低波动性(低百分位):波动带更贴近价格 🤏
- 高波动性(高百分位):波动带更宽,提供更多空间 🌐
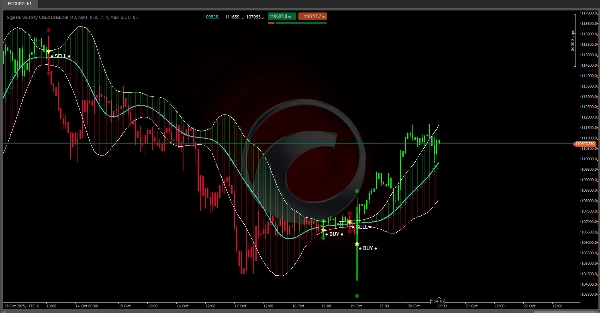
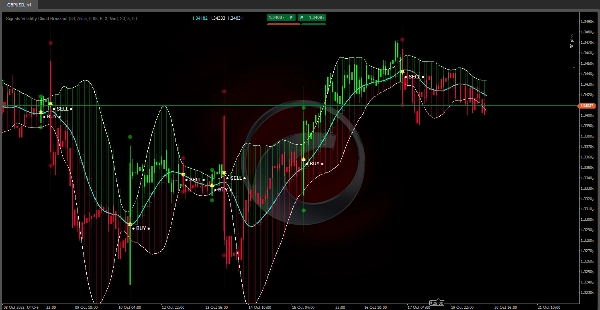
信号生成 🔔
当实际价格穿越自适应波动带时,信号被激活:
- 一旦信号激活,指标将保持趋势状态,直到发生相反的穿越,防止在盘整区出现过早信号。🛡️
它的用途是什么? 🛠️
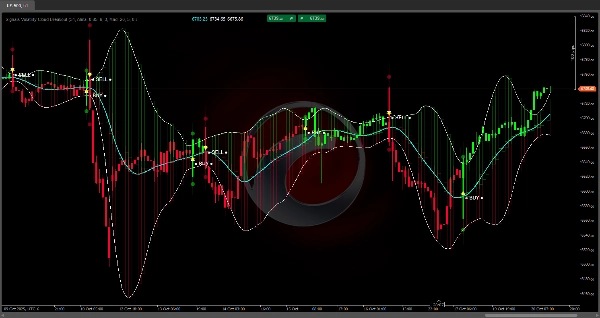
趋势识别 👀
该指标根据检测到的趋势方向为蜡烛着色,使您能够快速识别市场处于看涨还是看跌阶段。过滤线之间的色彩云层直观地强化了运动的强度和方向。
入场和出场点 ➡️🚪
标有显著图标的买入/卖出信号指示潜在的市场进出时机。这些信号旨在捕捉价格显示足够动量突破自适应波动带时的趋势起点。
仓位管理 💼
上下波动带作为以下参考水平:
- 确定动态止损
- 识别相对超买/超卖区域 🏷️
- 评估趋势是否减弱(价格回撤至中线) 📉
摘要
Key features include visual BUY/SELL signals triggered when price crosses the adaptive bands, candle coloring to indicate bullish or bearish trends, and colored clouds between filtered lines to represent trend strength. The bands also serve as dynamic reference levels for setting stops, identifying overbought or oversold conditions, and assessing trend strength. This indicator supports various markets including Forex, Crypto, Stocks, and symbols such as BTCUSD, EURUSD, GBPUSD, XAUUSD, and USDJPY. It is intended for trend identification, entry and exit timing, and position management within diverse trading environments.