
Beschreibung
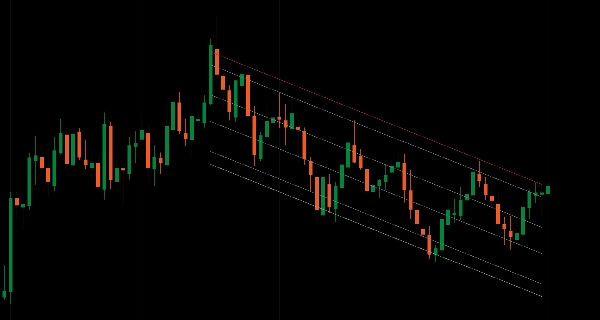
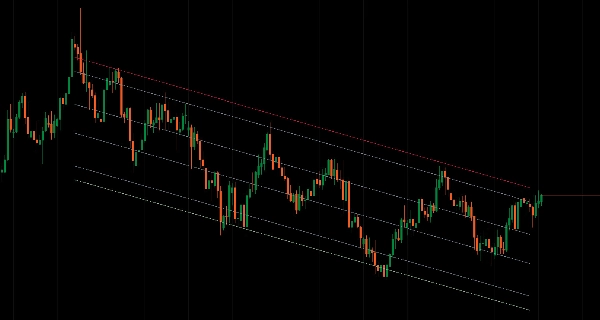
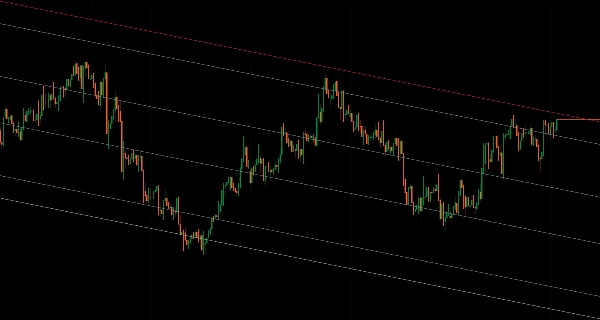
Statistische Regressionskanäle mit Fibonacci-Niveaus über mehrere Berechnungstypen, Zeitrahmen und Datumsbereiche hinweg.
Passt Regressionslinien durch Preisdaten mit acht Methoden an (Linear, Logarithmisch, Exponentiell, Gewichtet, Polynomisch, Gleitend, Exponentiell Gleitend, LOWESS) mit Standardabweichungsbändern für die Analyse der Mittelwertumkehr.
Neun Fibonacci-Kanalniveaus (0% bis 100%), Multi-Timeframe-Analyse über 16 Perioden mit interpolierter Darstellung, drei Berechnungsmodi (Periodenbasiert, Datumsbereich, MTF), Polynomgradsteuerung (1-5) für gekrümmte Trendstrukturen, Standardabweichungs-Multiplikator zur Anpassung der Kanalbreite, zeitzonenbewusste Datumszeit-Analyse für Ereignisanalysen, unendliche Trendlinienprojektion und optimiertes LRU-Caching bieten umfassende statistische Regressionsanalysen für Trader, die Mittelwertumkehrzonen und gekrümmte Preisstrukturen über Marktbedingungen hinweg anstreben.
EIGENSCHAFTEN
8 Regressions-Berechnungstypen
- Linear: Klassische kleinste-Quadrate-Lineare Regression
- Logarithmisch: Natürliche Logarithmus-basierte Regression für exponentielle Preisbewegungen
- Exponentiell: Exponentielle Kurvenanpassung für beschleunigende Trends
- Gewichtet: Lineare Regression mit stärker gewichteten jüngeren Balken
- Polynomisch: Gekrümmte Anpassungen (Grad 1-5) für nicht-lineare Trends
- Gleitend: Regressionsberechnung basierend auf gleitendem Durchschnitt
- Exponentiell Gleitend: EMA-basierte Regression zur Trendglättung
- LOWESS: Lokal gewichtete Regression für adaptive Glättung
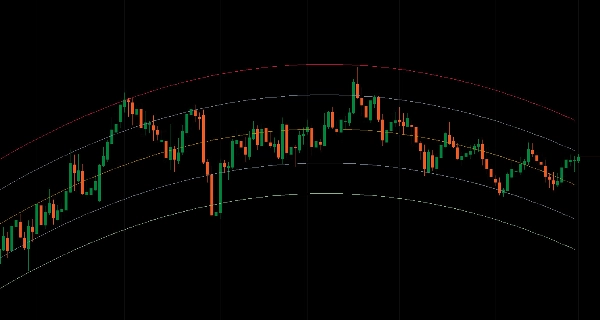
9 Fibonacci-Kanalniveaus
- Voller Kanalbereich: 100% (oben), 88,6%, 76,4%, 61,8%, 50% (Mittellinie), 38,2%, 23,6%, 11,4%, 0% (unten)
- Mittelwertumkehrzonen innerhalb der Regressionsbänder
- Präzise Unterstützungs-/Widerstandspunkte
- Unabhängige Farb-/Stil-/Dickensteuerung für jedes Niveau
Multi-Timeframe-Analyse
- Berechnung der Regression auf höherem Zeitrahmen, Anzeige im aktuellen Chart
- 16 verfügbare Zeitrahmen (m1 bis Monatlich)
- Interpolierte Kanalwerte für glatte Darstellung über Chart-Balken
- Struktur des höheren Zeitrahmens ohne Chartwechsel
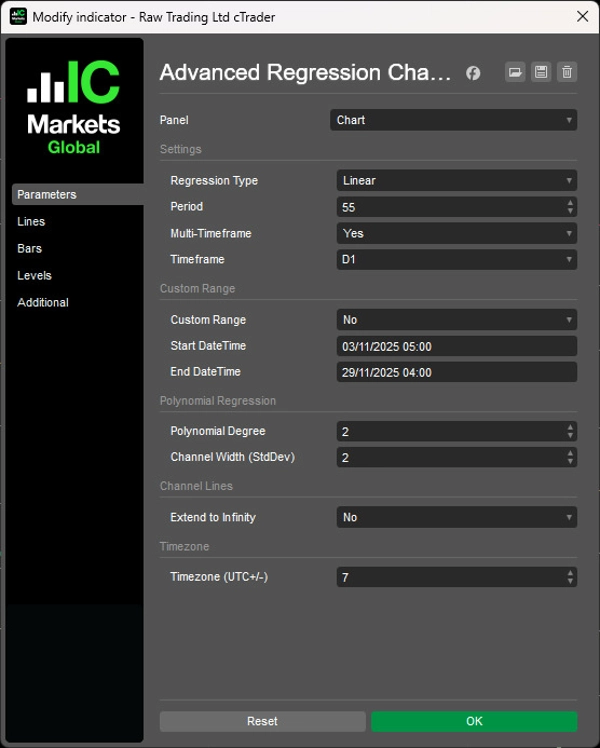
3 Berechnungsmodi
- Periodenbasiert: Rollierendes Fenster von N Balken (Standard)
- Datumsbereich: Benutzerdefinierter Start-/Endzeitpunkt für spezifische Ereignisse oder Phasen mit zeitzonenbewusster Datumszeit-Analyse (UTC+/- Offset)
Kanal-Anzeigeoptionen
- Standardausgabe: Alle 9 Niveaus als Indikatorlinien darstellen
- Unendlich verlängern: Als Trendlinien darstellen, die unbegrenzt nach vorne projizieren
- Automatische Aktualisierung bei Farb-/Stiländerungen
- Saubere Darstellung – keine Restwerte außerhalb des Berechnungsfensters
Datumsbereich-Modus
- Exakte Start-/Enddaten definieren (dd/MM/yyyy HH:mm-Format)
- Analyse spezifischer Markt-Ereignisse, Phasen oder Strukturen
- Unabhängig vom Periodenparameter
- Zeitzonenumrechnung von Benutzerlokalzeit zu Serverzeit
Dynamische Berechnung
- Echtzeit-Updates beim Entstehen neuer Balken
- Optimiertes LRU-Caching mit Dirty-Range-Tracking
- Adaptive Cache-Größenanpassung basierend auf Zeitrahmen
- Binäre Suche für schnelle Datumsbereich-Abfragen
Kanalbreitensteuerung
- Standardabweichungs-Multiplikator (Standard 2,0)
- Breitere Bänder für Volatilitätserweiterung
- Engere Bänder für Range-Märkte
- Konsistent über alle Regressionsarten
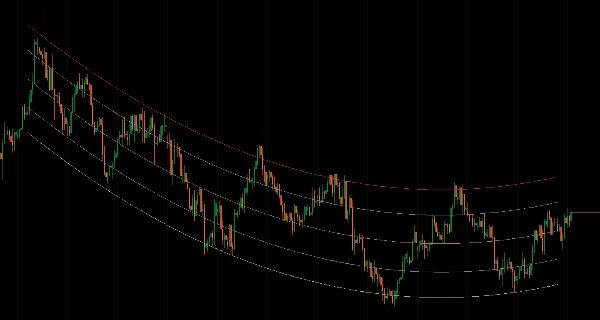
Polynomische Regression
- Gradsteuerung: 1-5 (höher = mehr Krümmung)
- Erfasst nicht-lineare Trends
- Nützlich für parabolische oder gekrümmte Preisstrukturen
- Fällt auf linear zurück, wenn Grad = 1
Sauberes visuelles Management
- Keine Berechnung bei entstehenden Balken – nur abgeschlossene Balken
- Korrekte Multi-Timeframe-Abschneidung – Linien enden am letzten abgeschlossenen HTF-Balken
- Steigungsbasierte Extrapolation für konsistente Richtungsprojektion
- Klare Ausgabereihen mit beschreibenden Levelnamen
__________________________________________________________________________________________
MEHR KOSTENLOSE INDIKATOREN
Entdecken Sie eine breite Palette von Marktanalysetools – von Struktur und Volumen bis hin zu Regression, Volatilität und benutzerdefinierten Zeitrahmen.
Der Quellcode ist auf GitHub Repository verfügbar.
Alle kostenlos nutzbar. Wenn Sie jedoch Kaffee-Unterstützung senden möchten, können Sie dies hier tun.
Unterstützung/Widerstand
Volumen
- Volumen-Aktivitätsprofiler
- Volumen-Effizienz-Analysator
- Volumenprofil-Analytik
- Volumenprofil - Aktualisiert
- Volumenstreuungsanalyse
- VWAP (Volumen-gewichteter Durchschnittspreis)
Gleitende Durchschnitte
- SSL-Kanal
- Verankerter gleitender Durchschnitt
- Abweichungsskaliertes gleitendes Mittel
- Gann High Low Aktivator
- Instantane Trendlinie
- Kaufman Adaptive MA mit Trend Vision
- Gleitender Durchschnittskanal
- Gleitende Durchschnitte Suite
- Trendkanal gleitender Durchschnitt
Dienstprogramme/Benutzerdefiniert
Regressionsbasiert
Volatilität
Oszillatoren
__________________________________________________________________________________________
HAFTUNGSAUSSCHLUSS
Der Handel birgt Risiken. Dieser Indikator ist nur für die technische Analyse gedacht – wenden Sie stets ein angemessenes Risikomanagement an und handeln Sie verantwortungsbewusst.
FEEDBACK & VERBESSERUNGEN
Wenn Sie Vorschläge, Funktionswünsche oder Ideen zur Verbesserung haben, hinterlassen Sie bitte einen Kommentar im Diskussions-Tab. Ihr Feedback hilft, den Indikator für alle zu verbessern.
Zusammenfassung
It offers multi-timeframe analysis across 16 periods (from 1 minute to monthly), enabling regression calculations on higher timeframes displayed on the current chart with smooth interpolated rendering. Users can select among three calculation modes: Period-Based (rolling window), Date Range (custom start/end with timezone-aware parsing), and Multi-Timeframe. Channel width is adjustable via a standard deviation multiplier to reflect market volatility.
The indicator features real-time dynamic updates, optimized caching for performance, and extend-to-infinity trendline projections for forward-looking analysis. Visual output is clean, with slope-based extrapolation and no calculations on forming bars. This tool is designed for traders analyzing mean reversion and complex price structures across various market conditions.


![„[Stellar Strategies] Inside Bar with Signals“-Logo](https://cdn.ctrader.com/image/webp/1d9e8bfa-3b2c-4440-bb37-5856902008a7_30683)


