Descripción
🚀 Más de 10,000 traders ya usan nuestros PRINCIPALES indicadores🏆
Descubre por qué los profesionales nos eligen: las herramientas más poderosas en cTrader (indicadores, algoritmos y cBots) te están esperando.
👉 Obtén todos nuestros sistemas TOP aquí:
_______________________________________________
📌 Indicadores de Estructura de Mercado
· ✅ AdvancedMarket Structure: Bos, Choch, SwinLevels, Order Blocks, Market Structure& Liquidity Finder
· 🔄 Análisis Dinámico de Estructura de Mercado de Puntos de Giro
· 🧱 Bloque de Orden
· ⛓️ BOS & CHOCH
· 🧠 ICT Poder de 3
· 🌀 Zonas de Polaridad de Mercado
_______________________________________________
🔚 Sistemas Inteligentes de Salida
· 📍 Algoritmo Inteligente de Seguimiento
_______________________________________________
📐 Indicadores ZigZag
· 🔍 Proyección de Liquidez de Precio ZigZag
· ➖ ZigZag
· 🎯 Rastreador de Extremos Zig-Zag
_______________________________________________
🧱 Indicadores de Soporte y Resistencia
· 🟩 Líneas de Soporte y Resistencia SmartTrend
· 🧱 Todos los Niveles de Soporte y Resistencia
_______________________________________________
📊 Indicadores de Tendencia y Canal
· 🔄 Canal de Tendencia Automático
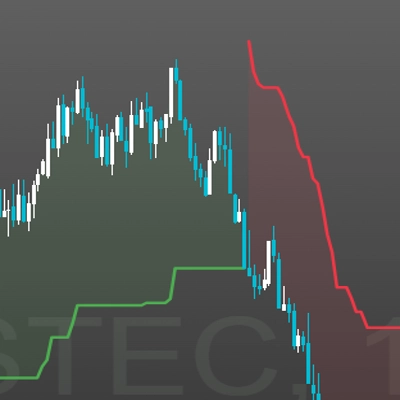
· 📊 Supertrend
· ⚡Analizador de Tendencia Momentum
· 🧠 Canal de Tendencia Adaptativo
· 💥 Sistema de Ruptura de Canal
· 🌈 Gradiente Dinámico de Tendencia
_______________________________________________
💧 Herramientas de Volumen y Liquidez
· 🔥 Mapa de Calor de POC de Volumen
· 📉 Mapa de Liquidación por Apalancamiento
· 🔍 Brecha de Valor Justo Momentum
· 🕒 Sesiones de Brecha de Valor Justo
_______________________________________________
⚡ Indicadores de Momentum y RSI
· 📈 Disparador de Tendencia RSI
· 🚀 Momentum de Rango Dinámico
· 🔎 Sesgo de Vela Multi-Nivel
Rastreador
_______________________________________________
🔮 Herramientas de Predicción y Proyección
· 📐 Predicción Basada en Linreg& ATR
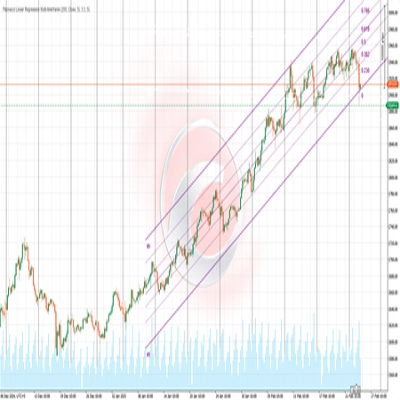
· 📏 Regresión Lineal Fibonacci Multi-timeframe
· 📈 Proyector de Flujo de Mercado Potenciado por Volumen
________________________________________________________________________________________________________
________________________________________________________________________________________________________
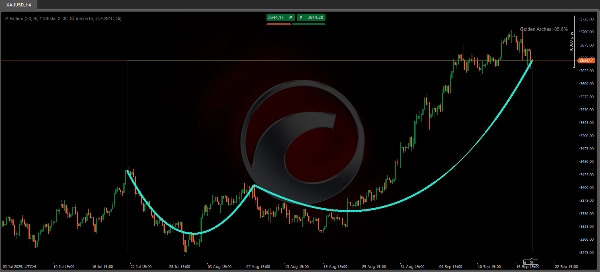
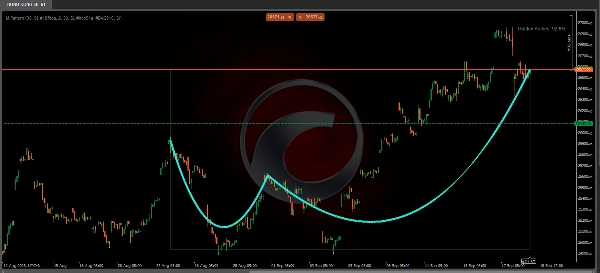
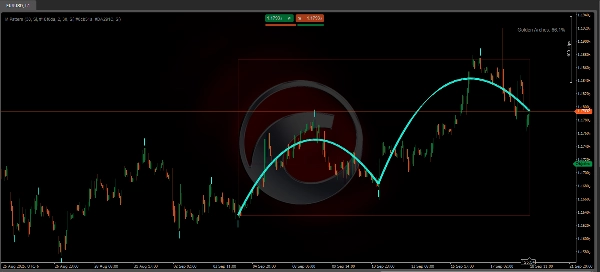
Curva Bézier del Patrón McDonalds 🍟
¿Para qué sirve? 🤔
El indicador "Curva Bézier del Patrón McDonalds" está diseñado para identificar y visualizar patrones de reversión de precio utilizando curvas Bézier. Su objetivo principal es detectar estructuras de mercado que se asemejen a arcos (similares a una "M" o "W") en los gráficos, lo que podría indicar posibles cambios de tendencia 🎯. Además, incluye un sistema de puntuación para evaluar la calidad del patrón detectado.
¿Cómo funciona? ⚙️
- Detección de Pivotes:
El indicador analiza un período de retroceso (definido por "Lookback Period") para identificar máximos y mínimos locales (pivotes). Estos se marcan con círculos en el gráfico: ⚪ - Curvas Bézier:
Una vez que se detectan al menos 5 pivotes, el indicador dibuja dos arcos usando curvas Bézier que conectan estos puntos. Estos arcos buscan suavizar la transición entre pivotes para formar una estructura visual similar a arcos gemelos ("Arcos Dorados") 🏛️. - Zona Coloreada:
Si está habilitada, se dibuja un área entre el primer y último pivote. El color de esta zona depende de la dirección del patrón: -
- 🟢 Verde: Tendencia alcista (si el último pivote es más alto).
- 🔴 Rojo: Tendencia bajista (si el último pivote es más bajo).
- Puntuación del Patrón:
Calcula un porcentaje que refleja la simetría y calidad de los arcos. Una puntuación más alta sugiere un patrón mejor definido.
¿Replotea (Replotting)? 🔄
Sí, este indicador replotea. Esto significa que sus dibujos y detecciones pueden cambiar retroactivamente a medida que se obtienen nuevos datos de precio. Esto se debe a que la identificación de esos puntos de inflexión se basa en observar un cierto número de barras después de la formación del pivote potencial. Por lo tanto, lo que parece un arco confirmado en datos históricos podría ajustarse o desaparecer cuando se aplica a gráficos en vivo 📊.
Podría usarse como ayuda complementaria en el análisis técnico.
¿Cómo podría usarse? 💡
- 📚 Análisis de Backtesting:
Útil para estudiar patrones históricos y evaluar su efectividad en diferentes activos o marcos temporales. - 👁️ Confirmación Visual:
Puede complementar otras herramientas de análisis (como soporte/resistencia o medias móviles) para validar posibles reversiones. - 🎓 Educación:
Ayuda a reconocer estructuras de mercado basadas en curvas Bézier, aunque su uso en trading en vivo requiere verificación adicional.
Limitaciones y Recomendaciones ⚠️
- Uso en Tiempo Real:
Dado que replotea, no debería usarse como señal independiente para entradas o salidas del mercado. - Optimización:
Ajusta el "Lookback Period" según el activo y el marco temporal para reducir señales falsas. - Contexto de Mercado:
Funciona mejor en mercados en tendencia y no en mercados laterales/rangueantes.
Nota Importante: 🚨
Dado que depende de datos futuros para la confirmación, debe usarse principalmente para analizar eventos ya ocurridos, como caídas posteriores a la apertura del mercado o ejercicios educativos con gráficos, en lugar de para propósitos predictivos o de trading en vivo. Aunque su enfoque es innovador, debe usarse junto con otros indicadores y análisis para evitar señales falsas debido a su naturaleza de reploteo. Es ideal para estudios de backtesting o como un complemento educativo en estrategias de trading.
Resumen
This tool repaints, meaning its visualizations and detections can change retroactively as new price data arrives, so it is best used for backtesting, educational purposes, or as a complementary aid alongside other technical analysis tools. It is optimized for trending markets and requires adjustment of the lookback period to suit different assets and timeframes. The indicator supports markets including Forex (e.g., EURUSD), commodities (e.g., XAUUSD), and cryptocurrencies (e.g., BTCUSD).