Descripción
Indicadores de Pinescriptlabs Store: cBots de Pinescriptlabs Store : (cBot) Gold & BTC BreakoutSession Pivots(nuevo)
Algoritmo Inteligente de Seguimiento (Nuevo)
Mapa de Liquidación de Apalancamiento
Predicción Basada en Linreg & ATR
Soporte y Tendencia Inteligente
Resistencia
Líneas
Sesiones de Brecha de Valor Justo
Análisis
Dinámico de
Estructura del Mercado
de
Puntos
de Giro
Regresión
Lineal
Fibonacci
Multitemporal
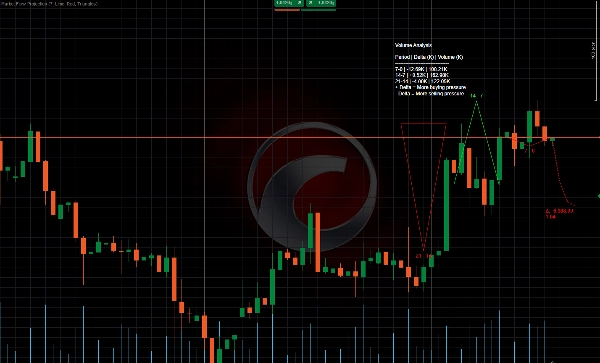
Brecha de Valor Justo de Momentum
Proyección del Flujo del Mercado
Gradiente de Tendencia Dinámico
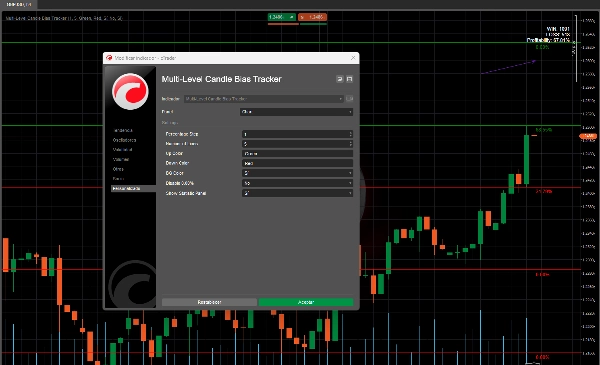
Rastreador de
Sesgo de Velas
Multinivel
Rastreador de Extremos Zig-Zag
Líneas de
Soporte y
Resistencia
Automáticas de Tendencia
Líneas
Todos
los Soportes y
Resistencias
Niveles
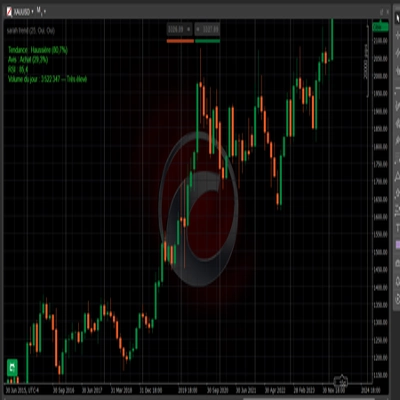
Este algoritmo determina la probabilidad de que el precio alcance un nuevo máximo o mínimo y lo representa como un nivel en el gráfico, acompañado de su porcentaje correspondiente. Este cálculo está probado retrospectivamente, y los resultados se muestran en una tabla, facilitando la comprensión de la probabilidad de que la siguiente vela establezca un nuevo máximo o mínimo. 📈📉
¿Cómo funciona? 🛠️
- Probabilidades de Nuevos Máximos y Mínimos 🎯
-
- El algoritmo analiza el comportamiento pasado del precio para calcular la probabilidad de que el precio haga un nuevo máximo o mínimo en la siguiente vela.
- Por ejemplo, si la probabilidad de un nuevo máximo es del 70%, es más probable que el precio suba. ⬆️
- Niveles con Porcentajes 📏
-
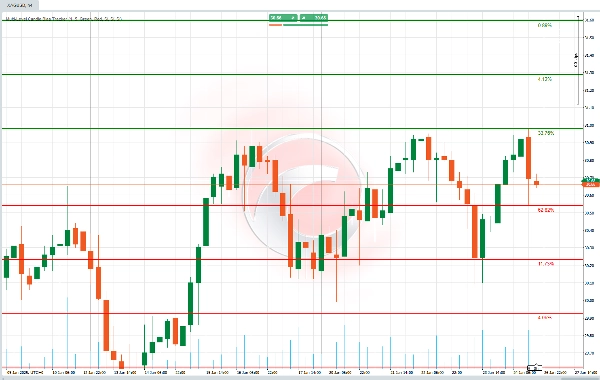
- Dibuja líneas horizontales en el gráfico que representan niveles clave, junto con un porcentaje que indica la probabilidad de que el precio alcance ese nivel.
- Estos niveles se calculan usando un porcentaje que defines (por ejemplo, 1%).
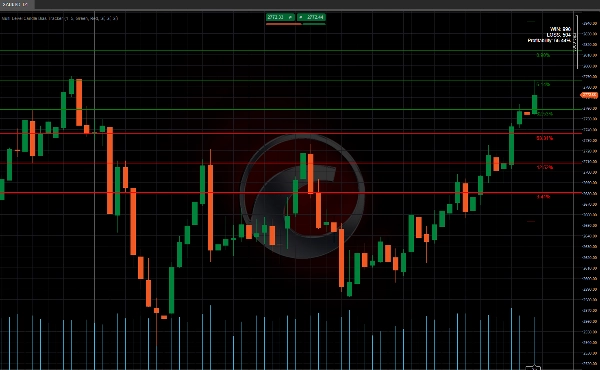
- Panel de Estadísticas 📊
-
- Muestra cuántas veces el precio ha alcanzado esos niveles (éxitos) y cuántas veces no.
- También proporciona un porcentaje de efectividad, indicándote si esos niveles han sido confiables en el pasado. ✅❌
¿Para qué sirve?
- Entender la dirección del precio: Te ayuda a saber si es más probable que el precio suba o baje en la siguiente vela. ⬆️⬇️
- Gestionar el riesgo: Si un nivel tiene baja probabilidad, puedes evitarlo para reducir decisiones arriesgadas.
¿Cómo lo usarías?
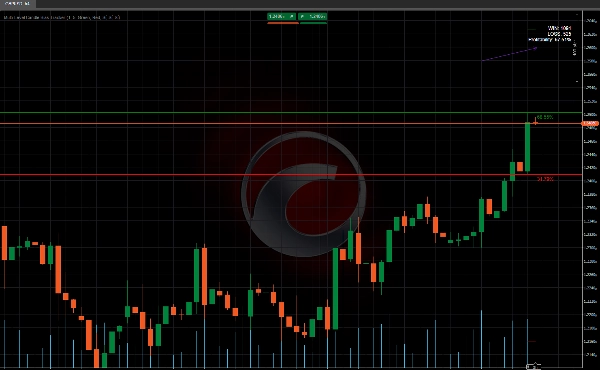
- Observa los niveles: Mira las líneas que el algoritmo dibuja en el gráfico. 👀
- Revisa las probabilidades: Si un nivel tiene alta probabilidad (por ejemplo, 70%), es más probable que el precio lo alcance. 📈
- Usa el panel de estadísticas: Revisa si esos niveles han funcionado bien en el pasado para decidir si confiar en ellos. 📊
Resumen
The indicator includes a statistics panel that shows how many times the price has successfully reached these levels versus how many times it has not, along with an effectiveness percentage reflecting the reliability of these levels based on historical data.
This tool is designed to help traders understand the likely direction of price movement in the next candle and manage risk by avoiding levels with low probabilities. Users apply it by observing the drawn levels, checking their associated probabilities, and reviewing the statistics panel to assess the historical performance of these signals.
Supported markets include commodities, cryptocurrencies (e.g., BTCUSD), and other symbols. The indicator integrates probability-based analysis into price action trading to assist in decision-making regarding potential breakout or trend continuation scenarios.
Valoraciones de clientes
5 | 100 % | |
4 | 0 % | |
3 | 0 % | |
2 | 0 % | |
1 | 0 % |