Description
🚀 Plus de 10 000 traders utilisent déjà nos MEILLEURS indicateurs🏆
👉 Obtenez tous nos MEILLEURS systèmes ici :
_______________________________________________
📌 Indicateurs de Structure de Marché
· ✅ AdvancedMarket Structure : Bos, Choch, SwinLevels, Order Blocks, Market Structure& Liquidity Finder
· 🔄 Analyse Dynamique de la Structure du Marché des Points de Renversement
· 🧱 Bloc d'Ordre
· ⛓️ BOS & CHOCH
· 🧠 ICT Power of 3
· 🌀 Zones de Polarité du Marché
_______________________________________________
🔚 Systèmes de Sortie Intelligents
· 📍 Algorithme Intelligent de Trailing
_______________________________________________
📐 Indicateurs ZigZag
· 🔍 Projection de Liquidité des Prix ZigZag
· ➖ ZigZag
_______________________________________________
🧱 Indicateurs de Support & Résistance
· 🟩 Lignes de Support & Résistance SmartTrend
· 🧱 Tous les Niveaux de Support et Résistance
_______________________________________________
📊 Indicateurs de Tendance & Canal
· 🔄 Canal de Tendance Automatique
· 📊 Supertrend
· ⚡Analyseur de Tendance Momentum
· 🧠 Canal de Tendance Adaptatif
· 💥 Système de Rupture de Canal
· 🌈 Gradient de Tendance Dynamique
_______________________________________________
💧 Outils de Volume & Liquidité
· 🔥 Carte Thermique Volume POC
· 📉 Carte de Liquidation à Effet de Levier
· 🔍 Écart de Valeur Juste Momentum
· 🕒 Sessions d'Écart de Valeur Juste
_______________________________________________
⚡ Indicateurs Momentum & RSI
· 📈 Déclencheur de Tendance RSI
· 🚀 Momentum de Plage Dynamique
· 🔎 Biais de Chandelle Multi-Niveaux
Suivi
_______________________________________________
🔮 Outils de Prédiction & Projection
· 📐 Prédiction Basée sur Linreg& ATR
· 📏 Régression Linéaire Fibonacci Multi-échelles
· 📈 Projecteur de Flux de Marché Alimenté par le Volume
________________________________________________________________________________________
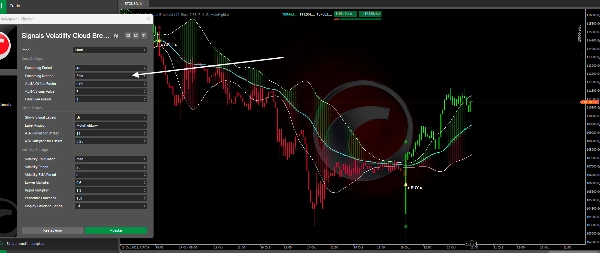
SIGNALS VOLATILITY CLOUD BREAKOUT.
Vue d'ensemble générale 💡
Adaptive Trend Bands est un indicateur avancé de suivi de tendance qui combine un filtrage adaptatif des prix avec des bandes de volatilité dynamiques. Contrairement aux indicateurs de bandes statiques traditionnels, ce système ajuste automatiquement sa sensibilité en fonction des conditions changeantes du marché, fournissant des signaux plus précis dans différents environnements de volatilité. 🎯
Que fait cet indicateur ? 🤔
L'indicateur génère une représentation filtrée et lissée du prix (OHLC) qui élimine le bruit du marché, permettant de visualiser la tendance sous-jacente avec une plus grande clarté. Simultanément, il calcule des bandes supérieures et inférieures qui s'élargissent ou se contractent automatiquement en fonction de la volatilité actuelle, s'adaptant aux marchés calmes ou turbulents. 🌊
Caractéristiques clés : ✨
- Filtrage adaptatif des prix utilisant les algorithmes ALMA ou EMA
- Bandes de volatilité qui s'ajustent dynamiquement en utilisant des percentiles historiques
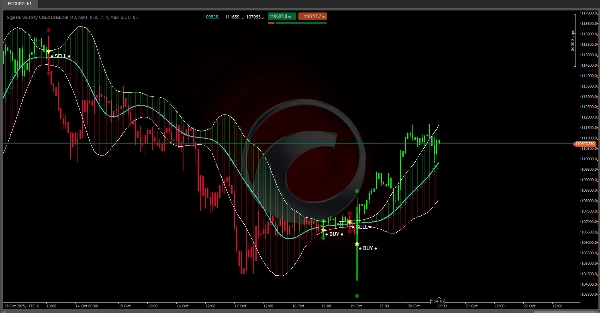
- Signaux visuels d'ACHAT/VENTE lorsque le prix franchit les bandes 🟢🔴
- Coloration des chandelles basée sur la tendance détectée (vert haussier / rouge baissier)
- Nuages colorés entre les lignes filtrées pour visualiser la force de la tendance 💪
Comment ça fonctionne ? ⚙️
Système de filtrage
L'indicateur applique un processus de lissage en deux étapes au prix :
- Première couche : Utilise ALMA (Moyenne Mobile d'Arnaud Legoux) ou des filtres EMA traditionnels pour éliminer les fluctuations à court terme. ALMA est particulièrement efficace car il réduit le retard tout en maintenant la douceur.
- Deuxième couche : Applique un lissage EMA supplémentaire au résultat du premier filtre, créant une ligne de tendance ultra-lisse qui réagit de manière équilibrée aux changements de prix.
Calcul adaptatif de la volatilité 📏
Le système mesure la volatilité du marché en utilisant deux méthodes :
- Écart-type (StdDev) : méthode classique de mesure de la dispersion
- Écart absolu moyen (MAD) : plus robuste face aux valeurs extrêmes
La volatilité calculée est lissée puis comparée à un historique des volatilités passées pour déterminer son rang percentile. Ce percentile contrôle le multiplicateur des bandes :
- Faible volatilité (percentile bas) : les bandes sont plus proches du prix 🤏
- Forte volatilité (percentile élevé) : les bandes sont plus larges, laissant de la place pour le mouvement 🌐
Génération de signaux 🔔
Les signaux sont activés lorsque le prix réel franchit les bandes adaptatives :
- Une fois qu'un signal est activé, l'indicateur maintient le statut de tendance jusqu'à ce que le croisement opposé se produise, évitant ainsi les signaux prématurés dans les zones de consolidation. 🛡️
À quoi sert-il ? 🛠️
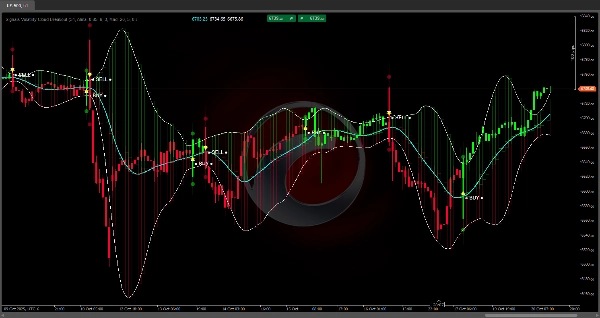
Identification de la tendance 👀
L'indicateur colore les chandelles selon la direction de la tendance détectée, vous permettant d'identifier rapidement si le marché est dans une phase haussière ou baissière. Les nuages colorés entre les lignes filtrées renforcent visuellement la force et la direction du mouvement.
Points d'entrée et de sortie ➡️🚪
Les signaux d'ACHAT/VENTE marqués par des icônes visibles indiquent les moments potentiels pour entrer ou sortir du marché. Ces signaux cherchent à capturer le début des tendances lorsque le prix montre suffisamment de momentum pour franchir les bandes adaptatives.
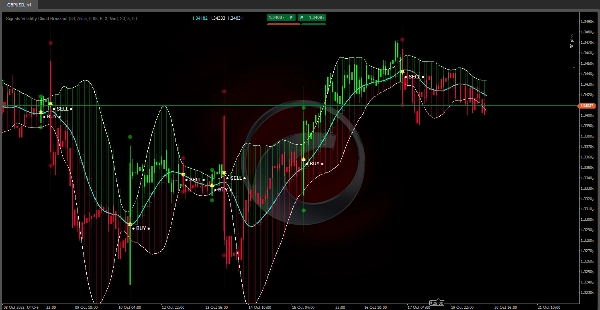
Gestion de position 💼
Les bandes supérieure et inférieure servent de niveaux de référence pour :
- Déterminer des stops dynamiques
- Identifier les zones relatives de surachat/survente 🏷️
- Évaluer si une tendance perd de la force (prix revenant vers la ligne centrale) 📉
Résumé
Key features include visual BUY/SELL signals triggered when price crosses the adaptive bands, candle coloring to indicate bullish or bearish trends, and colored clouds between filtered lines to represent trend strength. The bands also serve as dynamic reference levels for setting stops, identifying overbought or oversold conditions, and assessing trend strength. This indicator supports various markets including Forex, Crypto, Stocks, and symbols such as BTCUSD, EURUSD, GBPUSD, XAUUSD, and USDJPY. It is intended for trend identification, entry and exit timing, and position management within diverse trading environments.