
Description
Moyenne mobile basée sur l'efficacité qui ajuste dynamiquement la vitesse de lissage en fonction des conditions du marché.
Calcule le lissage via le Ratio d'Efficacité (mouvement directionnel vs. volatilité totale), réagissant rapidement dans les tendances et s'aplatissant pendant le bruit pour éviter les faux signaux.
Visualisation en trois états de couleur (Vert tendance haussière, Rouge tendance baissière, Bleu clair en range), paramètres de sensibilité configurables (Période, lissage rapide/lent, seuil ER), commutation automatique entre modes rapide et lent, et comportement dynamique de support/résistance offrant un suivi adaptatif des tendances pour les traders nécessitant réactivité dans les marchés directionnels et stabilité lors de la consolidation.
FONCTIONNALITÉS
Algorithme Adaptatif
- La vitesse de lissage change en fonction du Ratio d'Efficacité (ER) — le ratio du mouvement directionnel à la volatilité totale
- Réagit rapidement lorsque l'efficacité augmente
- S'aplatit lorsque le prix est bruyant pour éviter les faux signaux
- Distance dynamique par rapport au prix basée sur le comportement du marché
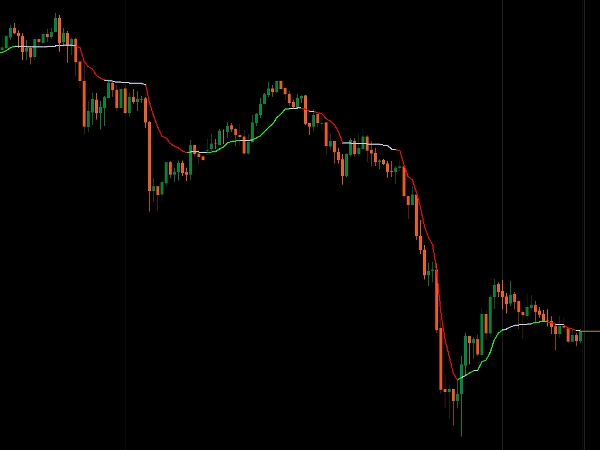
Visualisation en Trois États
- Vert : Forte tendance haussière (ER au-dessus du seuil + en hausse)
- Rouge : Forte tendance baissière (ER au-dessus du seuil + en baisse)
- Bleu clair : En range/agité (ER en dessous du seuil)
- Confirmation visuelle instantanée des conditions du marché
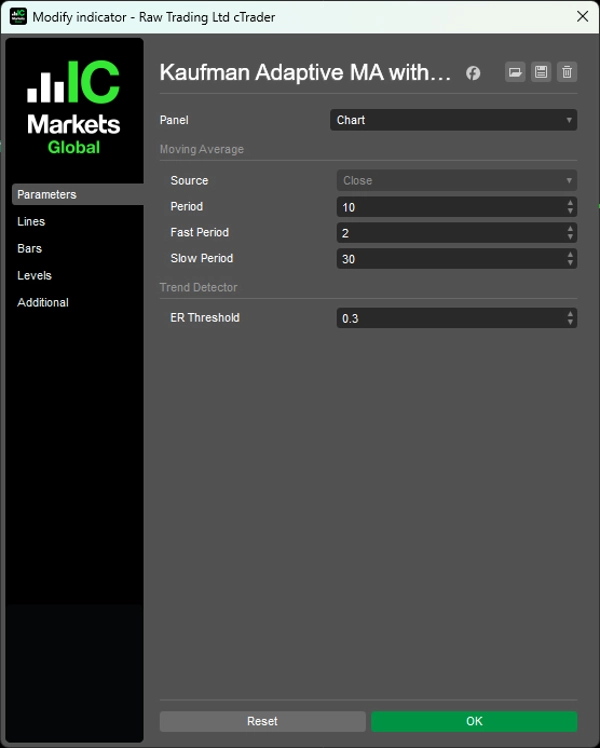
Sensibilité Configurable
- Période : Période de retour pour le calcul de l'efficacité (par défaut : 10)
- Période Rapide : Lissage dans les fortes tendances (par défaut : 2)
- Période Lente : Lissage dans les marchés en range (par défaut : 30)
- Seuil ER : Efficacité minimale pour qualifier une tendance (par défaut : 0,3)
Adaptation Intelligente
- Bascule automatiquement entre lissage rapide et lent
- Filtre le bruit dans les marchés agités
- Capture les tendances tôt lorsque les conditions changent
- Fonctionne comme support/résistance dynamique
__________________________________________________________________________________________
PLUS D'INDICATEURS GRATUITS
Explorez une large gamme d'outils d'analyse de marché — de la structure et du volume à la régression, la volatilité et les périodes personnalisées.
Le code source est disponible sur le dépôt GitHub.
Tous gratuits à utiliser. Mais si vous souhaitez offrir un café en soutien, vous pouvez le faire ici.
Support/Résistance
Volume
- Profileur d'Activité de Volume
- Analyseur d'Efficacité de Volume
- Analyse du Profil de Volume
- Profil de Volume - Mis à Jour
- Analyse de Répartition du Volume
- VWAP (Prix Moyen Pondéré par le Volume)
Moyennes Mobiles
- Canal SSL
- Moyenne Mobile Ancrée
- Moyenne Mobile Échelonnée par Déviation
- Activateur Haut Bas de Gann
- Ligne de Tendance Instantanée
- MA Adaptative de Kaufman avec Vision de Tendance
- Canal de Moyenne Mobile
- Suite de Moyennes Mobiles
- Moyenne Mobile du Canal de Tendance
Utilitaires/Personnalisés
Basé sur la Régression
Volatilité
Oscillateurs
__________________________________________________________________________________________
AVERTISSEMENT
Le trading comporte des risques. Cet indicateur est destiné uniquement à l'analyse technique — appliquez toujours une gestion des risques appropriée et tradez de manière responsable.
RETROACTION & AMELIORATIONS
Si vous avez des suggestions, des demandes de fonctionnalités ou des idées d'amélioration, veuillez laisser un commentaire dans l'onglet Discussion. Vos retours aident à améliorer l'indicateur pour tous.
Résumé
Key features include a three-state color-coded visualization: green for strong uptrends, red for strong downtrends, and light blue for ranging or choppy markets, providing immediate visual insight into market states. Users can configure sensitivity parameters such as lookback period, fast and slow smoothing periods, and the ER threshold to tailor responsiveness.
The indicator automatically switches between fast and slow smoothing modes, adapting to changing market behavior. It also acts as a dynamic support and resistance tool, helping traders identify trend shifts early while filtering out noise in consolidation phases. This adaptive approach supports scalping and other trading strategies requiring both responsiveness and stability in directional and ranging markets.


