
Description
🏆 Plus de 10 000 traders font confiance à notre suite de plus de 25 algorithmes ! 🏆
De Structure du marché & Liquidité à Systèmes de sortie intelligents & Outils prédictifs - nous avons construit TOUS les outils dont vous avez besoin pour être constant.
👉 Accédez à tous les 25+ systèmes PROUVÉS :
_______________________________________________
📌 Indicateurs de structure de marché
· 🔄 Analyse dynamique de la structure du marché des points de retournement
· 🧱 Bloc d'ordre
· ⛓️ BOS & CHOCH
· 🧠 ICT Power of 3
· 🌀 Zones de polarité du marché
_______________________________________________
🔚 Systèmes de sortie intelligents
· 📍 Algorithme intelligent de suivi
_______________________________________________
📐 Indicateurs ZigZag
· 🔍 Projection de liquidité des prix ZigZag
· ➖ ZigZag
· 🎯 Suivi des extrêmes Zig-Zag
_______________________________________________
🧱 Indicateurs de support & résistance
· 🟩 Lignes de support & résistance SmartTrend
· 🧱 Tous les niveaux de support et résistance
_______________________________________________
📊 Indicateurs de tendance & de canal
· 🔄 Canal de tendance automatique
· 📊 Supertrend
· ⚡Analyseur de tendance Momentum
· 🧠 Canal de tendance adaptatif
· 💥 Système de cassure de canal
· 🌈 Gradient de tendance dynamique
_______________________________________________
💧 Outils de volume & de liquidité
· 🔥 Carte thermique du POC de volume
· 📉 Carte de liquidation sur effet de levier
· 🔍 Écart de valeur équitable Momentum
· 🕒 Sessions d'écart de valeur équitable
_______________________________________________
⚡ Indicateurs Momentum & RSI
· 📈 Déclencheur de tendance RSI
· 🚀 Momentum de plage dynamique
· 🔎 Suivi du biais de chandelle multi-niveaux
Tracker
_______________________________________________
🔮 Outils de prédiction & projection
· 📐 Prédiction basée sur Linreg & ATR
· 📏 Régression linéaire Fibonacci Multi-timeframe
· 📈 Projecteur de flux de marché alimenté par le volume_________________________
_________________________________________________________________________________________________
_________________________________________________________________________________________________
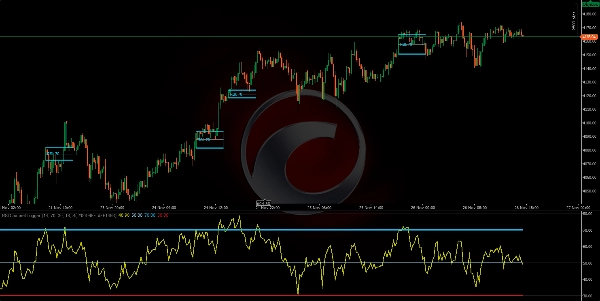
DÉCLENCHEUR DE CANAL RSI : 📶
Qu'est-ce que c'est : Un indicateur qui calcule le RSI(période) et marque visuellement les zones de momentum lorsque le RSI franchit les seuils de surachat/survente (par défaut 70/30). ✅
https://chartshots.spotware.com/c/69278f8b6d973
Logique : Lorsqu'un seuil est franchi, il crée une "zone" basée sur le plus haut/le plus bas de la bougie au moment du croisement. Ensuite : 🧠
- Colore les bougies à l'intérieur de cette zone.
- Dessine un canal (haut, bas, milieu).
- Marque le croisement sur le panneau RSI avec un cercle et une étiquette.
La zone dure exactement MinZoneDuration barres. ⏱️
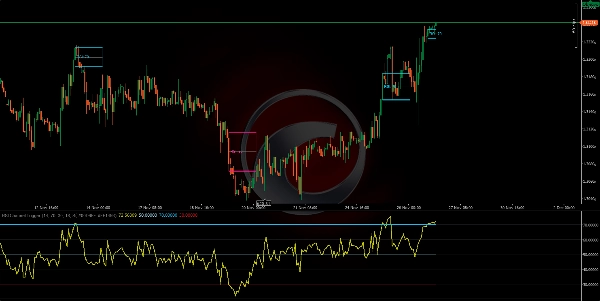
Signaux clairs :
- Croisement au-dessus du surachat → initie une zone haussière. 🟢
- Croisement en dessous du survente → initie une zone baissière. 🔴
La zone elle-même est une zone d'intérêt, pas un ordre.
https://chartshots.spotware.com/c/69278fb274e0b
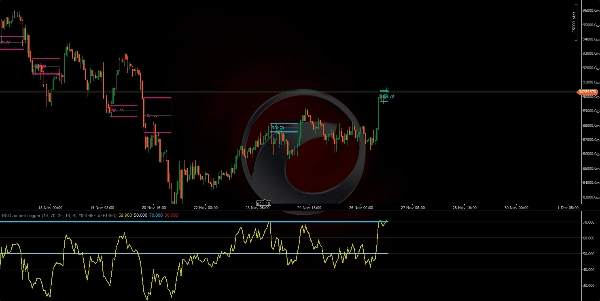
Comment utiliser (rapide) :
- Attendez que la zone se forme. 🎯
- Confirmez avec l'action des prix (cassure/rejet des lignes du canal).
- Entrez avec un stop loss en dehors de la zone et un objectif à la ligne médiane du canal ou un ratio risque/rendement défini.
https://chartshots.spotware.com/c/69278fe76237b
Paramètres clés : ⚙️
- Période RSI (14)
- Surachat (70)
- Survente (30)
- MinZoneDuration (15)
- Couleurs configurables 🎨
Résumé
Clear signals include:
- RSI crossing above the overbought level, initiating a bullish momentum zone.
- RSI crossing below the oversold level, initiating a bearish momentum zone.
These zones serve as areas of interest rather than direct trade orders. Users can confirm signals with price action such as breakouts or rejections from channel lines and plan entries with stop losses placed outside the zone and targets at the mid-channel line or based on risk/reward ratios.
The indicator supports multiple markets and symbols including Forex pairs (EURUSD, GBPUSD, NZDUSD, USDJPY), commodities (XAUUSD), indices (NAS100), cryptocurrencies (BTCUSD), and stocks. It offers configurable parameters for RSI period, threshold levels, zone duration, and colors.


![Logo de "[Hamster-Coder] Moving Average MTF"](https://cdn.ctrader.com/image/webp/b11b98b1-194d-4b8e-b00e-d611826ad159_31226)
