
Deskripsi
🚀 Lebih dari 10.000 trader sudah menggunakan indikator TERBAIK kami🏆
Temukan mengapa para profesional memilih kami – alat paling kuat di cTrader (indikator, algoritma, dan cBots) menunggu Anda.
👉 Dapatkan semua sistem TOP kami di sini:
_______________________________________________
_______________________________________________
📌 Indikator Struktur Pasar
· ✅ AdvancedMarket Structure: Bos, Choch, SwinLevels, Order Blocks, Market Structure& Liquidity Finder
· 🔄 Analisis Struktur Pasar Dinamis dari Titik Balik
· 🧱 Order Block
· ⛓️ BOS & CHOCH
· 🧠 ICT Power of 3
______________________________________________________________-
Toko cBots : 🧠 Gold & BTC BreakoutSession Pivots 🧠
_______________________________________________
🔚 Sistem Keluar Pintar
_______________________________________________
📐 Indikator ZigZag
· 🔍 Proyeksi Likuiditas Harga ZigZag
· ➖ ZigZag
· 🎯 Pelacak Ekstremitas Zig-Zag
_______________________________________________
🧱 Indikator Support & Resistance
· 🟩 Garis Support & Resistance SmartTrend
· 🧱 Semua Level Support dan Resistance
_______________________________________________
📊 Indikator Tren & Saluran
· 📊 Supertrend
· 🔁 Rata-Rata Bergerak Reaktif
_______________________________________________
💧 Alat Volume & Likuiditas
· 🔍 Celah Nilai Wajar Momentum
_______________________________________________
⚡ Indikator Momentum & RSI
· 📈 Pemicu Tren RSI
· 🔎 Pelacak Bias Lilin Multi-Level
_______________________________________________
🔮 Alat Prediksi & Proyeksi
· 📐 Prediksi Berdasarkan Linreg& ATR
· 📏 Regresi Linear Fibonacci Multi-timeframe
· 📈 Proyektor Aliran Pasar Berbasis Volume
_________________________________________________________________________________
_________________________________________________________________________________
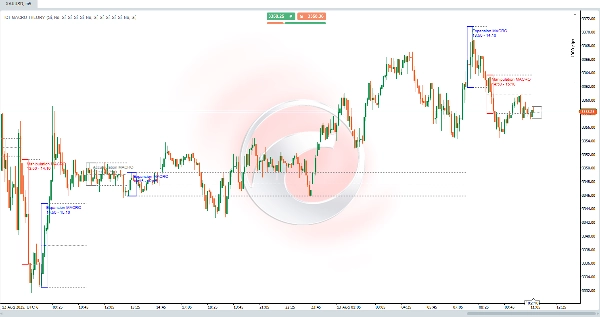
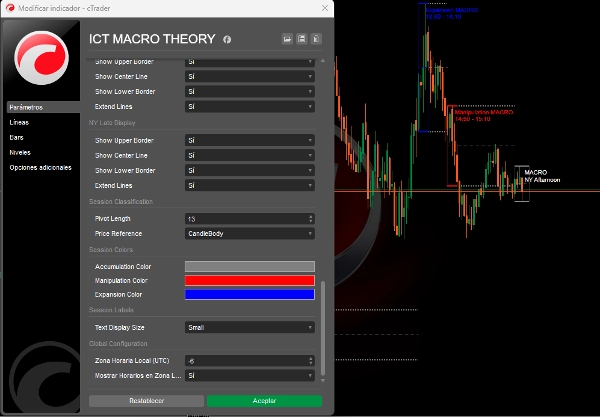
🌐 TEORI MAKRO ICT
⚠️ CATATAN PENTING: Indikator ini hanya berfungsi pada kerangka waktu di bawah 5 menit.
Penjelasan Periode Makro ICT
Periode makro ICT pada dasarnya adalah interval pendek di mana algoritma mencari likuiditas atau menyesuaikan harga untuk celah nilai wajar. Dasar dari makro ICT ini terletak pada teori waktu dan harga ICT.
Makro adalah "serangkaian instruksi pendek yang menciptakan suatu peristiwa dalam penyampaian harga", sebagaimana didefinisikan oleh ICT sendiri.
Makro ICT bukan strategi trading lengkap, tetapi dapat menambah konfluensi pada perdagangan Anda dan memaksimalkan keuntungan. Mereka terjadi selama sesi London, New York, tengah hari, dan sore.
🔮 Implementasi Lanjutan Teori Waktu Makro ICT:
Koneksi Langsung ke Konsep ICT:
Kode ini mengimplementasikan tepat 3 jenis makro ICT yang dijelaskan dalam teori, menggunakan logika klasifikasi berdasarkan:
- Analisis Struktur Pasar:
-
- Deteksi Sesi Makro
- Mencatat waktu ICT yang tepat (London 02:33, NY 09:50, dll.).
- Mendeteksi perubahan struktural sebelum dan selama setiap sesi makro.
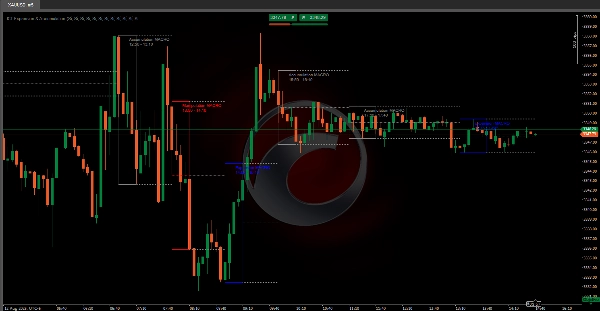
- Secara otomatis mengklasifikasikan ke dalam:
-
- 🟥 Manipulasi: Ketika harga menyapu likuiditas di kedua sisi (beli/jual).
- 🟦 Ekspansi: Pergerakan arah yang mengambil likuiditas di satu sisi (sejalan dengan tren).
- 🟩 Akumulasi: Rentang ketat di mana harga "mengakumulasi" likuiditas.
- Level Kunci yang Diperluas:
-
- Menggambar titik tertinggi/terendah setiap sesi makro.
- Menghitung dan memperluas harga rata-rata (titik tengah) ke sesi berikutnya.
- Level ini berfungsi sebagai support/resistance dinamis (Penting dalam ICT!).
- Deteksi Likuiditas Waktu Nyata:
-
- Menggunakan data 1 menit untuk mengidentifikasi pivot yang tepat (sama seperti yang terlihat pada kerangka waktu lebih rendah).
Peningkatan & Pembaruan Mendatang:
- Deteksi Penyapuan Likuiditas: Akan mengidentifikasi penyapuan likuiditas sebelumnya (titik tertinggi/terendah hari/minggu sebelumnya).
- Celah Nilai Wajar (FVG): Akan mendeteksi dan memvisualisasikan celah nilai wajar.
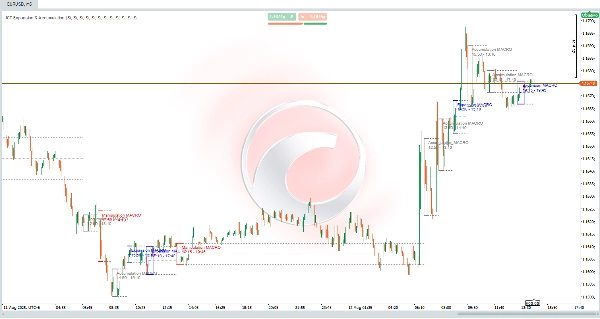
📊 Contoh Praktis ICT
Skenario Pembukaan NY (09:50-10:10):
- Pra-sesi: Harga menyapu likuiditas sisi beli (rendah lokal).
- Selama sesi:
-
- Diklasifikasikan sebagai 🟥 MANIPULASI.
- Harga beralih ke struktur bearish.
- Pasca-sesi:
-
- Garis yang diperpanjang menandai resistance pada titik tertinggi sesi.
- Penolakan perdagangan di zona dengan RR 1:3.
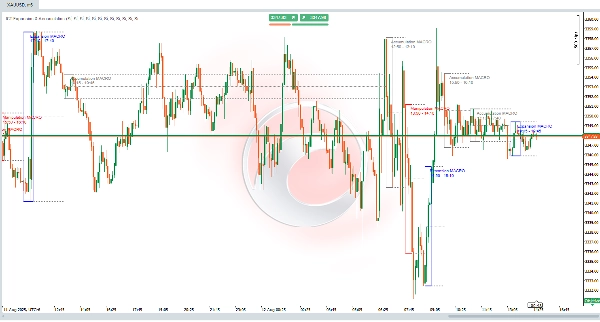
✅ Setia pada Prinsip ICT:
"Makro bukan strategi lengkap tetapi menambah konfluensi dengan mengidentifikasi di mana algoritma akan mencari likuiditas."
Ringkasan
The indicator analyzes market structure and detects key macro sessions—London, New York, midday, and afternoon—recording exact ICT times. It classifies price behavior into three types of macros: Manipulation (price sweeps liquidity on both sides), Expansion (directional movement aligned with trend), and Accumulation (tight range where price accumulates liquidity). It also draws and extends session highs, lows, and average price levels to act as dynamic support and resistance.
Using 1-minute data, ICT MACRO THEORY detects precise pivots for real-time liquidity identification. While not a complete trading strategy, it adds confluence to trades by highlighting where algorithms seek liquidity. Planned updates include detection of liquidity sweeps and visualization of fair value gaps.
This tool is intended for traders seeking to incorporate ICT macro time concepts into their analysis for enhanced market structure insight and liquidity detection on very short timeframes.


