Penerangan
Penunjuk Kedai Pinescriptlabs: Pinescriptlabs Kedai cBots : (cBot) Gold & BTC BreakoutSession Pivots(baru)
Struktur Pasaran Lanjutan: Bos, Choch, SwinLevels, Blok Pesanan, Pencari Struktur Pasaran & Kecairan (Baru)
Algoritma Pintar Jejak (baru)
Ramalan Berdasarkan Linreg & ATR
Sokongan &
Garis Rintangan
SmartTrend
Dinamik
Analisis Struktur Pasaran
dari
Titik
Pusingan
Fibonacci
Regresi Linear
Berbilang jangka masa
Berbilang Tahap
Penjejakan Lilin Bias
Penjejak
Auto
Sokongan dan
Rintangan
Garis Tren
Lines
Semua
Sokongan dan
Rintangan
Tahap
🌟 Usaha hebat daripada pasukan untuk membangunkan penunjuk Ctrader ini! Sokong kami dengan berkongsi - penambahbaikan visual termasuk skrol mendatar akan datang tidak lama lagi!
⚠️ Nota Teknikal: Zum/skrol manual kini diperlukan untuk tontonan optimum ("Had sementara: Berfungsi terbaik pada jangka masa di bawah 1H disebabkan kekangan visual platform Ctrader")
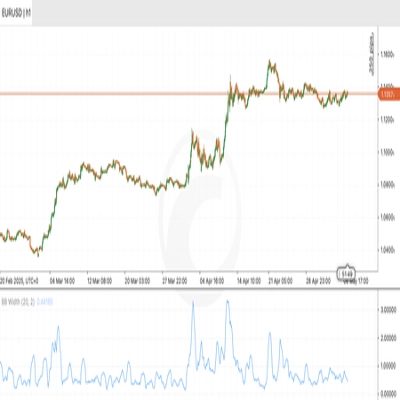
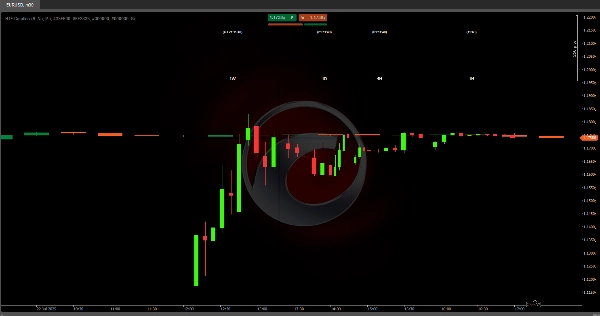
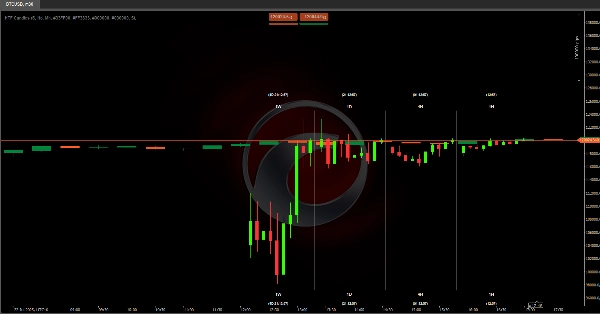
📊 Visualisasi HTF Masa Nyata
Algoritma ini memaparkan lilin jangka masa lebih tinggi (1M, 1H, 4H, 1H) terus pada carta dagangan anda, memberikan anda struktur pasaran lengkap dengan sekali pandang - tiada perlu bertukar tetingkap!
🔍 Analisis Pantas
Kenal pasti tren utama (arah harian/mingguan) semasa berdagang pada jangka masa lebih rendah
• Ciri Lanjutan: lilin HTF dikemas kini secara masa nyata - perubahan warna segera menunjukkan peralihan momentum
⚙️ Cara Menggunakan
• Togol blok HTF individu hidup/mati
• Laraskan lilin yang kelihatan (1-10 setiap jangka masa)
💡 Manfaat Mengubah Permainan
Kini anda boleh:
1️⃣ Menjangkakan penutupan lilin utama
2️⃣ Mengesan pembalikan tren secara langsung
3️⃣ Memantau tahap utama merentasi pelbagai jangka masa serentak
🚀 Penambahbaikan Akan Datang
Skrol mendatar akan membolehkan:
• Analisis corak HTF sejarah
• Perbandingan struktur semasa vs. lalu
• Pengenalpastian zon utama pada jangka masa lebih tinggi
📚 Contoh Praktikal
• Apabila 1M = hijau & 1H = merah → Pasaran sedang membetulkan dalam tren menaik → Hanya jual pendek pada pantulan rintangan utama
• Hierarki Tren: 1M > 1H > 4H > 1H → Sentiasa berdagang mengikut arah lilin mingguan
• Entri Konfluens:
- Harga pada sokongan 1H + lilin hijau 4H yang muncul = Peluang beli
- Rintangan pada tinggi 1H + lilin merah 4H = Jual pendek dengan henti di atas tinggi
• Corak Pecahan: - Jika lilin 1H memecah tinggi sebelumnya sebelum penutupan (pemasa aktif), jangkaan kesinambungan menaik
Ringkasan
Users can toggle individual higher timeframe candle blocks on or off and adjust the number of visible candles per timeframe (1 to 10). This facilitates monitoring of key levels and trend directions across multiple timeframes simultaneously. Practical use cases include anticipating candle closings, detecting live trend reversals, and identifying confluence entries based on support, resistance, and candle color changes.
Due to platform visual constraints, manual zoom and scroll are currently required for optimal viewing, especially on timeframes below 1 hour. Planned updates will introduce horizontal scrolling to enable historical pattern analysis, comparison of current versus past structures, and identification of key zones on higher timeframes.
HTF Candles supports traders in aligning trades with higher timeframe trends and enhances multi-timeframe market analysis within a single chart view.