Açıklama
🚀 10.000+ tüccar zaten en iyi göstergelerimizi🏆 kullanıyor
Profesyonellerin neden bizi seçtiğini keşfedin – en güçlü araçlar cTrader'da (göstergeler, algoritmalar ve cBotlar) sizi bekliyor.
👉 Tüm en iyi sistemlerimizi buradan edinin:
_______________________________________________
📌 Piyasa Yapısı Göstergeleri
· ✅ Gelişmiş Piyasa Yapısı: Bos, Choch, SwinLevels, Emir Blokları, Piyasa Yapısı& Likidite Bulucu
· 🔄 Dinamik Piyasa Yapısı Dönüş Noktalarının Analizi
· 🧱 Emir Bloğu
· ⚖️ Piyasa Dengesizliği
· ⛓️ BOS & CHOCH
· 🧠 ICT Gücü 3
_______________________________________________
🔚 Akıllı Çıkış Sistemleri
· 📍 Takip Eden Akıllı Algoritma
_______________________________________________
📐 ZigZag Göstergeleri
· 🔍 ZigZag Fiyat Likidite Projeksiyonu
· ➖ ZigZag
· 🎯 Zig-Zag Uç Nokta Takipçisi
_______________________________________________
🧱 Destek & Direnç Göstergeleri
· 🟩 Akıllı Trend Destek & Direnç Çizgileri
· 🧱 Tüm Destek ve Direnç Seviyeleri
_______________________________________________
📊 Trend & Kanal Göstergeleri
· 📊 Süpertrend
· 🧠 Uyarlanabilir Trend Kanalı
· 🔁 Reaktif Hareketli Ortalama
_______________________________________________
💧 Hacim & Likidite Araçları
· 🔍 Momentum Adil Değer Boşluğu
· 🕒 Adil Değer Boşluğu Seansları
_______________________________________________
⚡ Momentum & RSI Göstergeleri
· 🔎 Çok Katmanlı Mum Eğilimi
Takipçisi
_______________________________________________
🔮 Tahmin & Projeksiyon Araçları
· 📐 Linreg & ATR'ye Dayalı Tahmin
· 📏 Fibonacci Doğrusal Regresyon Çoklu Zaman Dilimi
· 📈 Hacim Destekli Piyasa Akışı Projeksiyonu
________________________________________________________________________________________________________
________________________________________________________________________________________________________
McDonalds Deseni Bézier Eğrisi 🍟
Ne için? 🤔
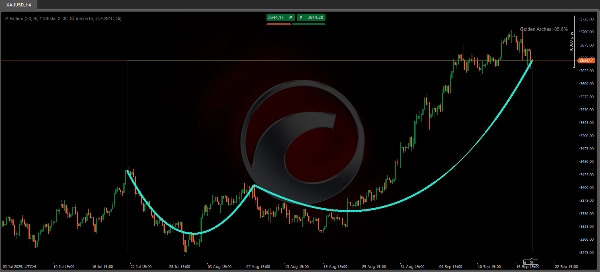
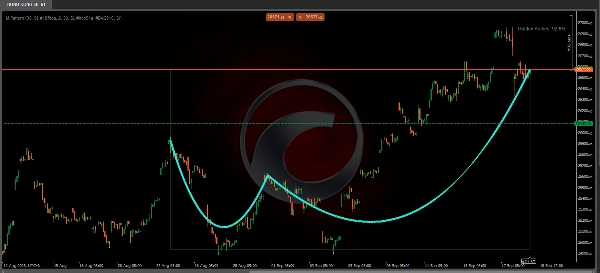
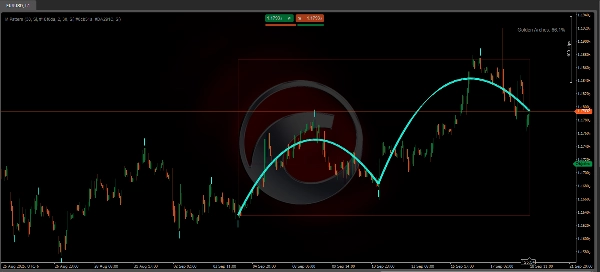
Bu "McDonalds Deseni Bézier Eğrisi" göstergesi, Bézier eğrileri kullanarak fiyat dönüşümlerini tespit etmek ve görselleştirmek için tasarlanmıştır. Ana amacı, grafiklerde yaylara benzeyen piyasa yapıları (bir "M" veya "W" gibi) tespit etmek olup, bu da potansiyel trend değişikliklerini 🎯 gösterebilir. Ayrıca, tespit edilen desenin kalitesini değerlendirmek için bir puanlama sistemi de içerir.
Nasıl çalışır? ⚙️
- Pivot Tespiti:
Gösterge, belirlenen "Lookback Period" aralığında yerel yüksek ve düşükleri (pivotları) tanımlar. Bunlar grafik üzerinde dairelerle işaretlenir: ⚪ - Bézier Eğrileri:
En az 5 pivot tespit edildikten sonra, gösterge bu noktaları birleştiren iki yay çizer. Bu yaylar, pivotlar arasındaki geçişi yumuşatarak ikiz kemerler ("Altın Kemerler") 🏛️ gibi görsel bir yapı oluşturmayı amaçlar. - Renkli Bölge:
Etkinleştirilirse, ilk ve son pivot arasında bir alan çizilir. Bu bölgenin rengi desenin yönüne bağlıdır: -
- 🟢 Yeşil: Yükselen trend (son pivot daha yüksekse).
- 🔴 Kırmızı: Düşen trend (son pivot daha düşükse).
- Desen Puanı:
Yayların simetrisi ve kalitesini yansıtan bir yüzde hesaplar. Daha yüksek puan daha iyi tanımlanmış bir deseni gösterir.
Yeniden çizim yapıyor mu (Replotting)? 🔄
Evet, bu gösterge yeniden çizim yapar. Bu, çizimlerinin ve tespitlerinin yeni fiyat verileri geldikçe geriye dönük olarak değişebileceği anlamına gelir. Çünkü bu dönüş noktalarının tanımlanması, potansiyel pivot oluşumundan sonra belirli sayıda bar gözlemlenmesine dayanır. Bu nedenle, geçmiş verilerde onaylanmış gibi görünen bir yay, canlı grafiklerde uygulandığında ayarlanabilir veya kaybolabilir 📊.
Teknik analizde tamamlayıcı bir yardım olarak kullanılabilir.
Nasıl kullanılabilir? 💡
- 📚 Geriye Dönük Test Analizi:
Tarihsel desenleri incelemek ve bunların farklı varlıklar veya zaman dilimleri üzerindeki etkinliğini değerlendirmek için faydalıdır. - 👁️ Görsel Doğrulama:
Potansiyel dönüşleri doğrulamak için diğer analiz araçları (destek/direnç veya hareketli ortalamalar gibi) ile tamamlayıcı olabilir. - 🎓 Eğitim:
Bézier eğrilerine dayalı piyasa yapılarını tanımaya yardımcı olur, ancak canlı işlemlerde ek doğrulama gerektirir.
Sınırlamalar ve Öneriler ⚠️
- Gerçek Zamanlı Kullanım:
Yeniden çizim yaptığı için, piyasa giriş veya çıkışları için bağımsız bir sinyal olarak kullanılmamalıdır. - Optimizasyon:
Yanlış sinyalleri azaltmak için varlık ve zaman dilimine göre "Lookback Period" ayarlanmalıdır. - Piyasa Bağlamı:
Yanlamasına/sınırlı piyasalarda değil, trend piyasalarında en iyi şekilde çalışır.
Önemli Not: 🚨
Onay için gelecekteki verilere dayanması nedeniyle, öncelikle zaten gerçekleşmiş olayları analiz etmek için kullanılmalıdır; örneğin piyasa açılışından sonraki düşüşler veya eğitim amaçlı grafik çalışmaları gibi. Tahmine veya canlı işlemlere yönelik değildir. Yaklaşımı yenilikçi olsa da, yeniden çizim yapma özelliği nedeniyle yanlış sinyallerden kaçınmak için diğer göstergeler ve analizlerle birlikte kullanılmalıdır. Geriye dönük test çalışmaları veya işlem stratejilerinde eğitsel bir tamamlayıcı olarak idealdir.
Özet
This tool repaints, meaning its visualizations and detections can change retroactively as new price data arrives, so it is best used for backtesting, educational purposes, or as a complementary aid alongside other technical analysis tools. It is optimized for trending markets and requires adjustment of the lookback period to suit different assets and timeframes. The indicator supports markets including Forex (e.g., EURUSD), commodities (e.g., XAUUSD), and cryptocurrencies (e.g., BTCUSD).