
Deskripsi
Sistem Trailing Adaptif 🚀
Sistem Trailing Adaptif adalah trailing stop adaptif canggih yang menggunakan volatilitas ternormalisasi logaritmik untuk secara otomatis menyesuaikan tingkat perlindungan keuntungan. 📊 Berbeda dengan trailing stop tradisional dengan jarak tetap, sistem ini menghitung jarak dinamis berdasarkan volatilitas pasar yang sebenarnya, terus menyesuaikan dengan kondisi yang berubah. 🔄
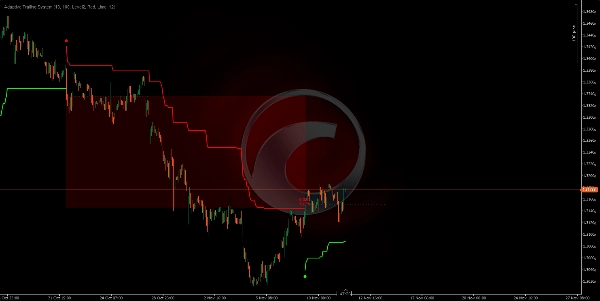
Spotware GBPUSD 691360763c684 | cTrader
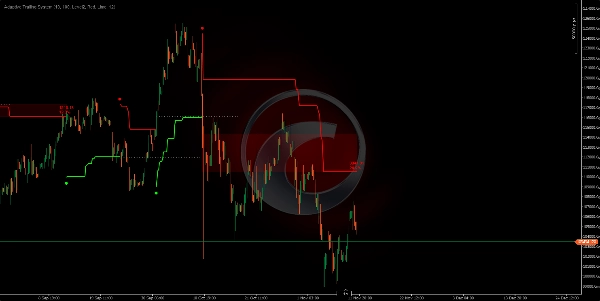
Spotware XAUUSD 691360adf1386 | cTrader
Spotware XAUUSD 691360adf1386 | cTrader
Algoritma Trailing Adaptif Unik ⚙️
Sistem menggunakan metode statistik yang tidak pernah menghasilkan jarak trailing yang sama:
• Menghitung True Range harga selama periode yang dapat dikonfigurasi.
• Menerapkan transformasi logaritmik pada nilai-nilai ini untuk menormalisasi distribusi.
• Menghitung rata-rata dan deviasi standar dari nilai-nilai logaritmik ini.
• Menghasilkan jarak offset unik berdasarkan tingkat volatilitas (0, 1, 2, atau 3 deviasi standar). 🎯
• Trailing stop terus disesuaikan menggunakan harga tipikal (rata-rata High, Low, Close).
Hasil: Setiap momen pasar memiliki jarak trailing sendiri, dihitung sesuai dengan volatilitas spesifik dari konteks tersebut. 🤖
Dasar Teknis: Volatilitas Ternormalisasi Logaritmik 🧠
Mengapa transformasi logaritmik? 🤔
Volatilitas pasar tidak mengikuti distribusi normal (Gaussian); cenderung memiliki nilai ekstrem. Transformasi logaritmik:
- Menormalkan distribusi: Mengubah data miring menjadi distribusi yang lebih simetris.
- Menstabilkan varians: Mengurangi dampak lonjakan volatilitas ekstrem.
- Memungkinkan perbandingan statistik: Memungkinkan penggunaan deviasi standar secara bermakna.
Proses Perhitungan Offset 🔢
- Periode True Range: Mengukur rentang maksimum, mempertimbangkan High-Low periode dan gap dengan penutupan sebelumnya.
- Logaritma Natural: Menerapkan
ln(True Range)untuk menormalisasi. - Jendela Normalisasi: Mempertahankan N nilai logaritmik terakhir (periode normalisasi).
- Rata-rata Logaritmik: Rata-rata semua
ln(TR)nilai dalam jendela. - Deviasi Standar: Menghitung penyebaran nilai logaritmik.
- Tingkat Volatilitas: Mengalikan deviasi dengan 0, 1, 2, atau 3 berdasarkan konfigurasi.
- Offset Akhir:
Offset = e^(mean + level × deviation)- mengubah kembali ke skala harga. 💡
Bagaimana Cara Kerjanya? ⚡
Mekanisme Trailing Dua Arah
Sistem beroperasi dalam dua mode bergantian:
Mode BEARISH (Short): 📉
• Trailing stop ditempatkan DI ATAS harga.
• Memperbarui ke bawah ketika harga turun (tidak pernah naik).
• Sinyal pembalikan ketika harga MENUTUP di atas trailing stop.
Mode BULLISH (Long): 📈
• Trailing stop ditempatkan DI BAWAH harga.
• Memperbarui ke atas ketika harga naik (tidak pernah turun).
• Sinyal pembalikan ketika harga MENUTUP di bawah trailing stop.
Sinyal Pembalikan:
• Titik melingkar menandai perubahan tren (masuk posisi baru).
• Warna hijau = Tren bullish baru (). ✅
• Warna merah = Tren bearish baru (). 🔴
Parameter dan Dampak 🎛️
Periode Perhitungan (10)
- Fungsi: Menentukan berapa banyak bar yang digunakan untuk menghitung True Range.
- ↑ Lebih tinggi (20-50): Mengukur volatilitas jangka panjang, lebih halus, kurang sensitif.
- ↓ Lebih rendah (5-8): Mengukur volatilitas jangka pendek, lebih reaktif, mendeteksi perubahan cepat.
Periode Normalisasi (100)
- Fungsi: Jendela nilai logaritmik untuk menghitung rata-rata dan deviasi standar.
- ↑ Lebih tinggi (200-500): Normalisasi lebih stabil, perubahan offset bertahap.
- ↓ Lebih rendah (50-80): Normalisasi lebih reaktif, offset menyesuaikan lebih cepat.
- Dampak Kritis: Parameter ini menentukan seberapa "teringat" konteks volatilitas historis. 🧠
Tingkat Volatilitas (Level 2)
- Fungsi: Jumlah deviasi standar yang diterapkan pada perhitungan offset.
- Level 0 (0σ): Offset = rata-rata logaritmik = jarak terketat, sensitivitas maksimum. 🎯
- Level 1 (1σ): Offset mencakup 1 deviasi = jarak sedang, menangkap ~68% variasi.
- Level 2 (2σ): Offset mencakup 2 deviasi = jarak lebih lebar, menangkap ~95% variasi (seimbang). ⚖️
- Level 3 (3σ): Offset mencakup 3 deviasi = jarak sangat lebar, menangkap ~99% variasi, toleransi maksimum. 🛡️
___________________________________________________________________________________________________
🚀 Lebih dari 10.000 trader sudah menggunakan indikator🏆 terbaik kami
👉 Dapatkan semua sistem TOP kami di sini:
_______________________________________________
📌 Indikator Struktur Pasar
· ✅ AdvancedMarket Structure: Bos, Choch, SwinLevels, Order Blocks, Market Structure& Liquidity Finder
· 🔄 Dynamic Market StructureAnalysis of Turning Points
· 🧱 Order Block
· ⚖️ Market Imbalance
· ⛓️ BOS & CHOCH
· 🧠 ICT Power of 3
_______________________________________________
🔚 Sistem Keluar Pintar
_______________________________________________
📐 Indikator ZigZag
· 🔍 ZigZag Price LiquidityProjection
· ➖ ZigZag
_______________________________________________
🧱 Indikator Support & Resistance
· 🟩 SmartTrend Support &Resistance Lines
· 🧱 All Support and ResistanceLevels
_______________________________________________
📊 Indikator Tren & Saluran
· 📊 Supertrend
_______________________________________________
💧 Alat Volume & Likuiditas
_______________________________________________
⚡ Indikator Momentum & RSI
· 🔎 Multi-Level Candle Bias
Tracker
_______________________________________________
🔮 Alat Prediksi & Proyeksi
· 📐 Prediksi Berdasarkan Linreg& ATR
· 📏 Fibonacci Linear RegressionMulti-timeframe
· 📈 Volume-Powered Market Flow Projector_________________________________________________________________________________________________
Ringkasan
The system operates bidirectionally with two modes:
- Bearish (short) mode places the trailing stop above the price, adjusting downward as price falls, signaling a reversal when price closes above the stop.
- Bullish (long) mode places the trailing stop below the price, adjusting upward as price rises, signaling a reversal when price closes below the stop.
Reversal signals are visually marked with colored dots indicating trend changes (green for bullish, red for bearish). Key parameters include the calculation period for True Range, normalization period for volatility data, and volatility level defining the offset distance based on standard deviations.
This indicator supports various markets including Forex, cryptocurrencies, commodities, indices, and stocks, with symbols such as BTCUSD, EURUSD, GBPUSD, XAUUSD, NAS100, and USDJPY. It is designed to provide adaptive trailing stops that respond to real-time volatility, enhancing trade exit strategies.


