
Description
🚀 10,000+ traders already use our TOP indicators🏆
👉 Get all our TOP systems here:
_______________________________________________
📌 Market Structure Indicators
· ✅ AdvancedMarket Structure: Bos, Choch, SwinLevels, Order Blocks, Market Structure& Liquidity Finder
· 🔄 Dynamic Market StructureAnalysis of Turning Points
· 🧱 Order Block
· ⚖️ Market Imbalance
· ⛓️ BOS & CHOCH
· 🧠 ICT Power of 3
_______________________________________________
🔚 Smart Exit Systems
_______________________________________________
📐 ZigZag Indicators
· 🔍 ZigZag Price LiquidityProjection
· ➖ ZigZag
_______________________________________________
🧱 Support & Resistance Indicators
· 🟩 SmartTrend Support &Resistance Lines
· 🧱 All Support and ResistanceLevels
_______________________________________________
📊 Trend & Channel Indicators
· 📊 Supertrend
_______________________________________________
💧 Volume & Liquidity Tools
_______________________________________________
⚡ Momentum & RSI Indicators
· 🔎 Multi-Level Candle Bias
Tracker
_______________________________________________
🔮 Prediction & Projection Tools
· 📐 Prediction Based on Linreg& ATR
· 📏 Fibonacci Linear RegressionMulti-timeframe
· 📈 Volume-Powered Market Flow Projector
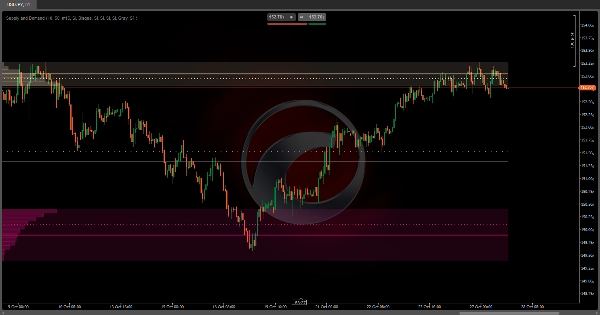
Auto Supply and Demand: 💹
Auto Supply and Demand is an advanced volume analysis indicator that automatically identifies the zones of highest trading activity on your chart. 📊 Unlike other static indicators, this one dynamically adjusts to the visual range you are observing, recalculating the zones every time you zoom or scroll through the chart.
How does it work? ❓
The algorithm divides the visible price range into multiple horizontal levels (configurable from 2 to 500 divisions) and analyzes the volume traded at each level. To achieve greater precision, it uses data from a lower timeframe than the one you are observing. 🕒 For example, if you are looking at a 1-hour chart, it can analyze 15-minute candles to detect in greater detail where the volume was actually concentrated.
The Identification Process 🔍
The indicator works from the extremes towards the center:
- From the highest price: 🚀 It starts at the high of the visible range and descends level by level, accumulating the volume traded in each price band.
- From the lowest price: 📉 Simultaneously, it rises from the low, accumulating volume in an upward direction.
- Activation threshold: ⚡ When any of these zones accumulates a specific percentage of the total volume (configurable, 10% by default), it is marked as a significant zone and the search in that direction stops.
- Middle zone: ⚖️ Once both zones (upper and lower) are identified, the intermediate space is marked as a neutral or balance zone.
What is it for? 🎯
This indicator is a market structure analysis tool that helps you to:
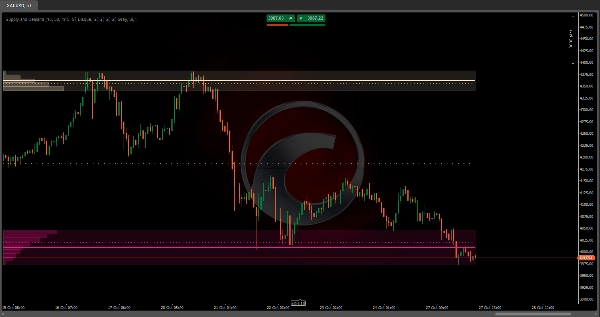
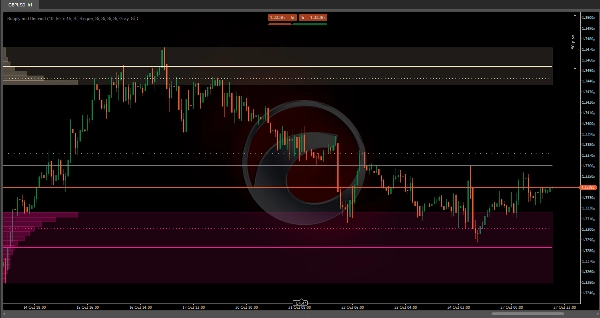
- Identify Supply zones: 🏔️ Upper areas where there was historically high selling activity.
- Identify Demand zones: 🏖️ Lower areas where buying activity was concentrated.
- Detect Balance zones: 🎭 The middle range where buying and selling pressure balance each other.
These zones tend to act as magnets for the price in the future, as they represent levels where many participants took positions. 🧲
How can it be combined? 🔗
With price action strategies:
- Wait for retests of the identified zones to look for reversal confirmations.
- Use the zones as profit-taking targets or stop-loss placement.
With trend indicators:
- In an uptrend, look for entries when the price retests the lower demand zone. 📈
- In a downtrend, use the upper supply zone as resistance for sales. 📉
With multiple timeframe analysis:
- Identify zones on higher timeframes and look for confirmations on lower timeframes.
- Zones from a higher timeframe can contain multiple zones on lower timeframes.
With momentum indicators:
- Combine with RSI or Stochastic to confirm overbought/oversold conditions in the zones.
- Divergences in the supply/demand zones can signal potential reversals.
Customizable Configuration ⚙️
The indicator allows you to completely adjust each zone independently:
- Activate/deactivate each visual element (areas, average lines, weighted lines).
- Volume threshold: What percentage of the total volume must be accumulated to consider a zone significant.
- Price divisions: Higher number = greater precision but more calculations.
- Lower timeframe: Defines the granularity of the volume analysis.
Key Feature: Automatic Adaptation 🔄
Automatic recalculation based on your view. This means that:
- If you zoom in to see the detail of a session, it will identify the specific supply and demand zones for those hours.
- If you zoom out to see weeks or months, it will recalculate the macro zones for the entire period.
- Every time you scroll through the chart, the zones update to reflect the context of the visible range.
Summary
The indicator divides the visible price range into configurable horizontal levels (2 to 500 divisions) and analyzes volume traded at each level using data from a lower timeframe than the chart’s timeframe for enhanced accuracy. It identifies significant zones by accumulating volume from the highest and lowest visible prices until a configurable volume threshold (default 10%) is reached, marking these as supply and demand zones respectively. The area between these zones is designated as a balance zone, representing equilibrium between buying and selling pressures.
These zones highlight areas of historically high trading activity that often act as future price magnets. The indicator supports customization of visual elements, volume thresholds, price divisions, and analysis timeframe. It can be combined with price action strategies, trend indicators, multiple timeframe analysis, and momentum indicators like RSI or Stochastic to improve trade entries, exits, and confirmations.
Supported markets include Forex, Indices, Commodities, Stocks, and Cryptocurrencies, with symbols such as EURUSD, GBPUSD, BTCUSD, XAUUSD, and NAS100.
Customer reviews
5 | 50 % | |
4 | 0 % | |
3 | 0 % | |
2 | 0 % | |
1 | 50 % |


!["[Stellar Strategies] Inside Bar with Signals" logo](https://cdn.ctrader.com/image/webp/1d9e8bfa-3b2c-4440-bb37-5856902008a7_30683)


