"RSI Channel Trigger" โลโก้
RSI Channel Trigger
"RSI Channel Trigger" ภาพที่อัปโหลด
ตั้งแต่ 03/10/2024
143
การขาย
32K
ติดตั้งฟรี

🏆 10,000+ Traders Trust Our 25+ Algorithm Suite! 🏆

From Market Structure & Liquidity to Smart Exit Systems & Predictive Tools - we've built EVERY tool you need for consistent.

👉 Access All 25+ PROVEN Systems:

_______________________________________________

📌 Market Structure Indicators

·     ✅ AdvancedMarket Structure: Bos, Choch, SwinLevels, Order Blocks,  Market Structure& Liquidity Finder

🔥Pivot Breakout Detector

·     🔄 Dynamic Market StructureAnalysis of Turning Points

·     🧱 Order Block

·     ⚖️ Market Imbalance

·     ⛓️ BOS & CHOCH

·     🧠 ICT Power of 3

·     🌀 Market Polarity Zones

_______________________________________________

🔚 Smart Exit Systems

·     📍 Trailing Smart Algorithm

_______________________________________________

📐 ZigZag Indicators

·     🔍 ZigZag Price LiquidityProjection

·     🧭 S&R Structural ZigZag

·     ➖ ZigZag

·     🎯 Zig-Zag Extremity Tracker

_______________________________________________

🧱 Support & Resistance Indicators

·     🟩 SmartTrend Support &Resistance Lines

·     🧱 All Support and ResistanceLevels

_______________________________________________

📊 Trend & Channel Indicators

·     🔄 Auto-Trend Channel

·     📊 Supertrend

·     ⚡Momentum Trend Analyzer

·     🧠 Adaptive Trend Channel

·     💥 Channel Breakout System

·     🌈 Dynamic Trend Gradient

·     ⭐ PREMIUM SSL CHANNEL

·     🔁 Reactive Moving Average

_______________________________________________

💧 Volume & Liquidity Tools

·     🔥 Volume POC Heatmap

·     📉 Leverage Liquidation Map

·     🔍 Momentum Fair Value Gap

·     🕒 Fair Value Gap Sessions

_______________________________________________

Momentum & RSI Indicators

·     📈 RSI Trend Trigger

·     🚀 Dynamic Range Momentum

·     🔎 Multi-Level Candle Bias
Tracker

_______________________________________________

🔮 Prediction & Projection Tools

·     📐 Prediction Based on Linreg& ATR

·     📏 Fibonacci Linear RegressionMulti-timeframe

·     📈 Volume-Powered Market Flow Projector_________________________

_________________________________________________________________________________________________

_________________________________________________________________________________________________

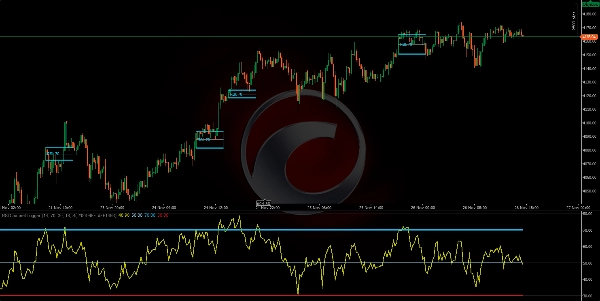
RSI CHANNEL TRIGGER: 📶

What it is: An indicator that calculates the RSI(period) and visually marks momentum zones when the RSI crosses the overbought/oversold thresholds (default 70/30). ✅

https://chartshots.spotware.com/c/69278f8b6d973

Logic: When a threshold is crossed, it creates a "zone" based on the high/low of the candle at the moment of the crossover. It then: 🧠

  • Colors the candles inside that zone.
  • Draws a channel (high, low, mid).
  • Marks the crossover on the RSI panel with a circle and a label.
    The zone lasts for exactly MinZoneDuration bars. ⏱️
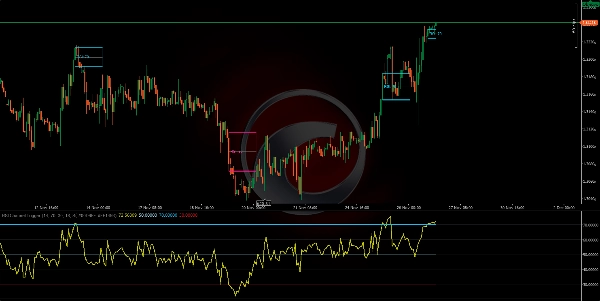
Clear signals:

  • Crossover above Overbought → initiates a bullish zone. 🟢
  • Crossover below Oversold → initiates a bearish zone. 🔴
    The zone itself is an area of interest, not an order.

https://chartshots.spotware.com/c/69278fb274e0b
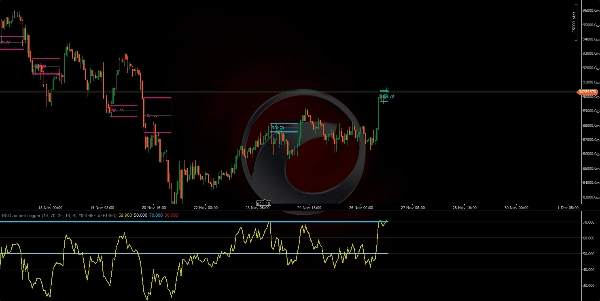
How to use (quick):

  1. Wait for the zone to form. 🎯
  2. Confirm with price action (breakout/rejection from the channel lines).
  3. Enter with a stop loss outside the zone and a target at the mid-channel line or a defined Risk/Reward ratio.


https://chartshots.spotware.com/c/69278fe76237b

Key Parameters: ⚙️

  • RSI Period (14)
  • Overbought (70)
  • Oversold (30)
  • MinZoneDuration (15)
  • Configurable colors 🎨
Indicator profile
0.0
รีวิว: 0
รีวิวจากลูกค้า
ยังไม่มีรีวิวสำหรับผลิตภัณฑ์นี้ หากเคยลองแล้ว ขอเชิญมาเป็นคนแรกที่บอกคนอื่น!
BTCUSD
Forex
RSI
Indices
EURUSD
Commodities
GBPUSD
NZDUSD
Prop
Crypto
Stocks
XAUUSD
NAS100
USDJPY
Products available through cTrader Store, including trading bots, indicators and plugins, are provided by third-party developers and made available for informational and technical access purposes only. cTrader Store is not a broker and does not provide investment advice, personal recommendations or any guarantee of future performance.

เพิ่มเติมจากผู้เขียนคนนี้

"ZigZag" โลโก้
4.3
(6)
ฟรี
ZigZag filters noise, spots trends, patterns, pivots, aiding analysis, trade management, and confirmations. 📉📈
"Order Block" โลโก้
5.0
(1)
$ 19
Identify bullish and bearish Order Blocks to spot key support/resistance levels and potential trend reversals! 📈🔄
"Volume POC Heatmap" โลโก้
5.0
(4)
ฟรี
📊 Shows volume by price levels, highlights POC, and key zones. Identifies dynamic support/resistance and imbalances.
"BOS & CHOCH" โลโก้
5.0
(2)
$ 19
/
$25
Market structural patterns , specifically the concepts of Change of Character (ChoCH) 🔄 and Break of Structure (BoS) 💥
"Auto-Trend Channel" โลโก้
4.4
(5)
ฟรี
Adaptive trend channel using linear regression and Pearson correlation for dynamic support, resistance, and trends.
"Identify key market zones and visualize support/resistance from multiple timeframes on a single chart.
📊Zones Supply & Demand: Identifies key price levels with high volume concentration, marking Supply/Demand Zones & Marke
"Supertrend" โลโก้
$ 19
💹 Define a price channel 📈 and determine trend direction (bullish 🟢 or bearish 🔴).
"Fair Value Gap Sessions" โลโก้
5.0
(4)
ฟรี
identify and highlight temporary market inefficiencies known as "fair value gaps" 🚨 within specific trading Sessions.
Identify market structure effortlessly with swing highs, lows, CHoCH, and BOS levels for smart trading decisions! 📊🔍"
Detects bullish and bearish divergences
Advanced price action tool that combines multiple technical analysis concepts

นอกจากนี้คุณยังอาจชอบ

Visual Trend Momentum is a MA/ATR/Volume trend tool. Visual signals for strong trends & reversals. Customizable. 📈📉
"Complete Professional Trading Dashboard" โลโก้
$ 24
/
$35
Traders Panel: Scan 15 pairs across 5 timeframes. Live heatmap, strength rankings and best setups in one panel.
Custom and native timeframes display with OHLC lines, moving averages, and Fibonacci levels.
📈 Divergency v1.1 Indicator for cTrader: A Comprehensive Guide 🚀
Brooks price action breakout mode patterns
BoS ChoCH Pro,Strict Mode,False Breakout Filter,Average hit rate: 72-78%
"session indicator" โลโก้
$ 20
📈 Trading Sessions Indicator — London, New York & Tokyo Visualize Key Market Sessions + High/Low Levels with Precision
Future-AI indicator.
Multi-timeframe S/R, SRWMA trend & Demarker pivots with smart alerts—clarity for any market, any timeframe.
The Ichimoku Cloud is a comprehensive technical analysis system developed by Japanese journalist Goichi Hosoda
"MACD Indicator NDH" โลโก้
5.0
(2)
ฟรี
MACD Indicator with Histogram that plots Colors Based on Direction Above and Below the Zero Line.
Percent Range Keys 000
Comprehensive SMC tool: swing & internal structure, Orderblock detection,equal highs/lows,premium/equilibrium/discount.
"QQE-MTF" โลโก้
$ 36
Multi-timeframe version of the Quantitative Qualitative Estimation (QQE) indicator.
"rvwap v1" โลโก้
$ 19
Rolling VWAP with dynamic or fixed time window, customizable source price and standard deviation bands.
"VMM PriceRange Analyzer" โลโก้
5.0
(1)
$ 49
Multi-timeframe ATR, smart swap calculator, range analysis all in one professional panel.
INSTITUTIONAL VWAP
"Swing LowHigh" โลโก้
5.0
(1)
$ 40
/
$50
Auto-detects Swing Highs/Lows to draw dynamic Support & Resistance levels with break tracking.
ตั้งแต่ 03/10/2024
143
การขาย
32K
ติดตั้งฟรี