Descrição
🚀 Mais de 10.000 traders já usam nossos PRINCIPAIS indicadores🏆
👉 Obtenha todos os nossos PRINCIPAIS sistemas aqui:
_______________________________________________
📌 Indicadores de Estrutura de Mercado
· ✅ AdvancedMarket Structure: Bos, Choch, SwinLevels, Order Blocks, Market Structure& Liquidity Finder
· 🔄 Análise Dinâmica da Estrutura de Mercado de Pontos de Reversão
· 🧱 Order Block
· ⛓️ BOS & CHOCH
· 🧠 ICT Power of 3
· 🌀 Zonas de Polaridade de Mercado
_______________________________________________
🔚 Sistemas Inteligentes de Saída
· 📍 Algoritmo Inteligente de Trailing
_______________________________________________
📐 Indicadores ZigZag
· 🔍 Projeção de Liquidez de Preço ZigZag
· ➖ ZigZag
· 🎯 Rastreador de Extremos Zig-Zag
_______________________________________________
🧱 Indicadores de Suporte & Resistência
· 🟩 Linhas Inteligentes de Suporte & Resistência SmartTrend
· 🧱 Todos os Níveis de Suporte e Resistência
_______________________________________________
📊 Indicadores de Tendência & Canal
· 🔄 Canal de Tendência Automático
· 📊 Supertrend
· ⚡Analisador de Tendência Momentum
· 🧠 Canal de Tendência Adaptativo
· 💥 Sistema de Rompimento de Canal
· 🌈 Gradiente Dinâmico de Tendência
_______________________________________________
💧 Ferramentas de Volume & Liquidez
· 📉 Mapa de Liquidação de Alavancagem
· 🔍 Gap de Valor Justo Momentum
· 🕒 Sessões de Gap de Valor Justo
_______________________________________________
⚡ Indicadores de Momentum & RSI
· 🚀 Momentum de Alcance Dinâmico
· 🔎 Viés de Vela Multi-Nível
Rastreador
_______________________________________________
🔮 Ferramentas de Previsão & Projeção
· 📐 Previsão Baseada em Linreg& ATR
· 📏 Regressão Linear Fibonacci Multi-tempo
· 📈 Projetor de Fluxo de Mercado Potencializado por Volume
Oferta e Demanda Automáticas: 💹
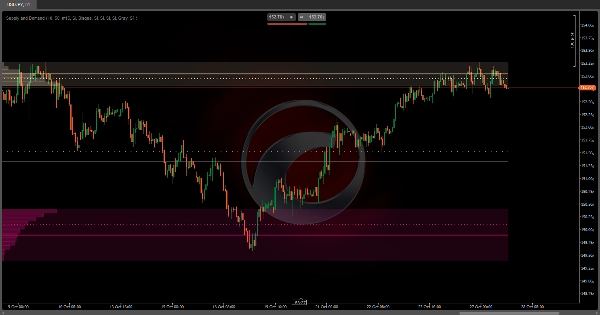
Oferta e Demanda Automáticas é um indicador avançado de análise de volume que identifica automaticamente as zonas de maior atividade de negociação no seu gráfico. 📊 Diferente de outros indicadores estáticos, este se ajusta dinamicamente ao intervalo visual que você está observando, recalculando as zonas toda vez que você dá zoom ou rola pelo gráfico.
Como funciona? ❓
O algoritmo divide o intervalo de preço visível em múltiplos níveis horizontais (configuráveis de 2 a 500 divisões) e analisa o volume negociado em cada nível. Para alcançar maior precisão, ele usa dados de um timeframe inferior ao que você está observando. 🕒 Por exemplo, se você está olhando um gráfico de 1 hora, ele pode analisar velas de 15 minutos para detectar com mais detalhe onde o volume realmente se concentrou.
O Processo de Identificação 🔍
O indicador trabalha dos extremos para o centro:
- Do preço mais alto: 🚀 Começa no topo do intervalo visível e desce nível por nível, acumulando o volume negociado em cada faixa de preço.
- Do preço mais baixo: 📉 Simultaneamente, sobe a partir da mínima, acumulando volume em direção ascendente.
- Limite de ativação: ⚡ Quando qualquer dessas zonas acumula uma porcentagem específica do volume total (configurável, 10% por padrão), ela é marcada como uma zona significativa e a busca nessa direção para.
- Zona intermediária: ⚖️ Uma vez identificadas ambas as zonas (superior e inferior), o espaço intermediário é marcado como uma zona neutra ou de equilíbrio.
Para que serve? 🎯
Este indicador é uma ferramenta de análise da estrutura de mercado que ajuda você a:
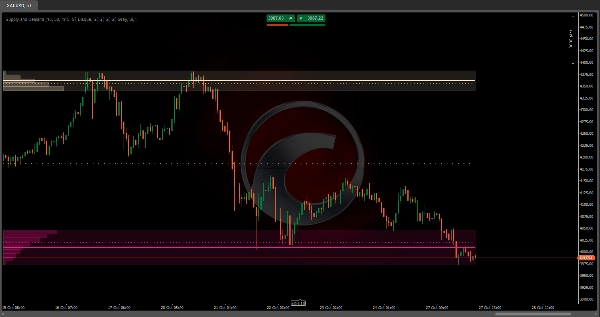
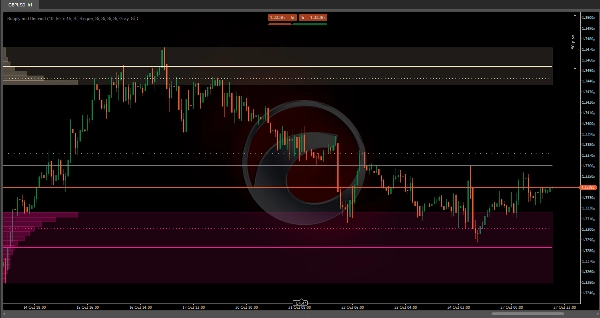
- Identificar zonas de oferta: 🏔️ Áreas superiores onde historicamente houve alta atividade de venda.
- Identificar zonas de demanda: 🏖️ Áreas inferiores onde a atividade de compra foi concentrada.
- Detectar zonas de equilíbrio: 🎭 A faixa intermediária onde a pressão de compra e venda se equilibram.
Essas zonas tendem a agir como ímãs para o preço no futuro, pois representam níveis onde muitos participantes tomaram posições. 🧲
Como pode ser combinado? 🔗
Com estratégias de price action:
- Espere por retestes das zonas identificadas para buscar confirmações de reversão.
- Use as zonas como alvos de realização de lucro ou colocação de stop-loss.
Com indicadores de tendência:
- Em uma tendência de alta, procure entradas quando o preço retestar a zona inferior de demanda. 📈
- Em uma tendência de baixa, use a zona superior de oferta como resistência para vendas. 📉
Com análise de múltiplos timeframes:
- Identifique zonas em timeframes superiores e procure confirmações em timeframes inferiores.
- Zonas de um timeframe superior podem conter múltiplas zonas em timeframes inferiores.
Com indicadores de momentum:
- Combine com RSI ou Estocástico para confirmar condições de sobrecompra/sobrevenda nas zonas.
- Divergências nas zonas de oferta/demanda podem sinalizar potenciais reversões.
Configuração Personalizável ⚙️
O indicador permite ajustar completamente cada zona de forma independente:
- Ativar/desativar cada elemento visual (áreas, linhas médias, linhas ponderadas).
- Limite de volume: Qual porcentagem do volume total deve ser acumulada para considerar uma zona significativa.
- Divisões de preço: Número maior = maior precisão, mas mais cálculos.
- Timeframe inferior: Define a granularidade da análise de volume.
Característica Principal: Adaptação Automática 🔄
Recalculo automático baseado na sua visualização. Isso significa que:
- Se você der zoom in para ver o detalhe de uma sessão, ele identificará as zonas específicas de oferta e demanda para aquelas horas.
- Se você der zoom out para ver semanas ou meses, ele recalculará as macrozonas para todo o período.
- Toda vez que você rolar pelo gráfico, as zonas se atualizam para refletir o contexto do intervalo visível.
Resumo
The indicator divides the visible price range into configurable horizontal levels (2 to 500 divisions) and analyzes volume traded at each level using data from a lower timeframe than the chart’s timeframe for enhanced accuracy. It identifies significant zones by accumulating volume from the highest and lowest visible prices until a configurable volume threshold (default 10%) is reached, marking these as supply and demand zones respectively. The area between these zones is designated as a balance zone, representing equilibrium between buying and selling pressures.
These zones highlight areas of historically high trading activity that often act as future price magnets. The indicator supports customization of visual elements, volume thresholds, price divisions, and analysis timeframe. It can be combined with price action strategies, trend indicators, multiple timeframe analysis, and momentum indicators like RSI or Stochastic to improve trade entries, exits, and confirmations.
Supported markets include Forex, Indices, Commodities, Stocks, and Cryptocurrencies, with symbols such as EURUSD, GBPUSD, BTCUSD, XAUUSD, and NAS100.
Avaliações de clientes
5 | 50 % | |
4 | 0 % | |
3 | 0 % | |
2 | 0 % | |
1 | 50 % |