
Descrição
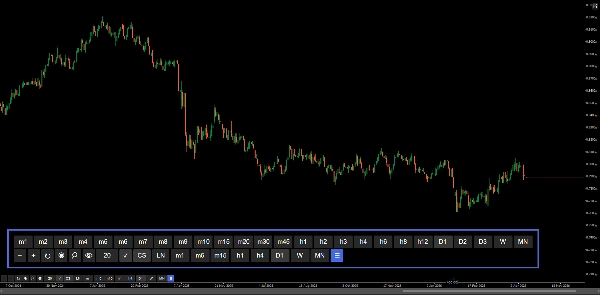
Painel de controle do gráfico para navegação mais rápida — zoom, período e configuração do gráfico sem sair do gráfico.
Predefinições de zoom, entrada manual de zoom, seletor completo de período e gráfico, períodos favoritos configuráveis, separadores de período, grade de números arredondados e linhas de oferta/demanda ao vivo — tudo acessível por meio de botões na interface do gráfico. Projetado para reduzir o tempo gasto navegando pelos menus nativos do cTrader durante sessões de negociação ativas.
RECURSOS
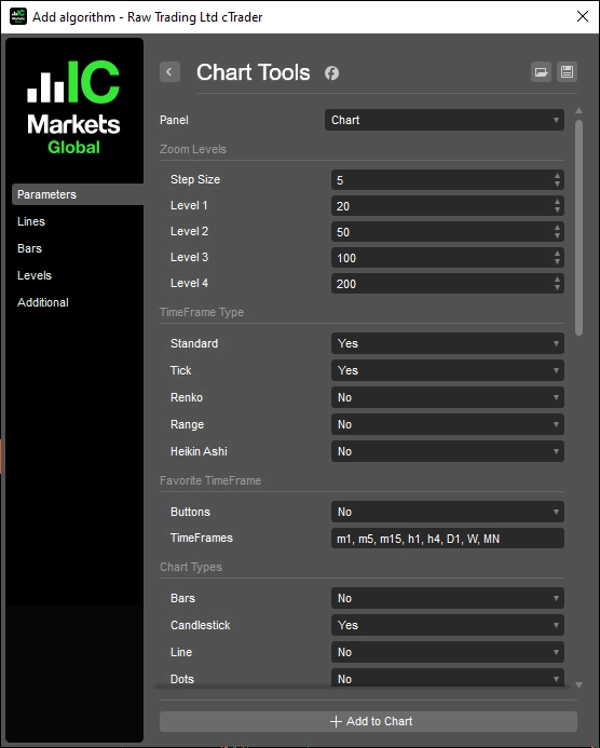
Controles de Zoom
- Zoom in / zoom out com tamanho de passo configurável
- Quatro níveis de zoom predefinidos configuráveis para acesso com um clique
- Entrada manual de zoom com botão aplicar
- Sincroniza com os eventos nativos de zoom do cTrader
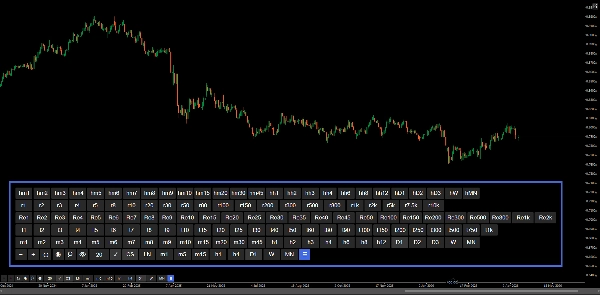
Seletor de Período
- Painel completo de botões cobrindo todos os tipos de período: Standard, Heikin Ashi, Renko, Range, Tick
- Modo All exibe cada tipo como linhas separadas
- Período ativo destacado automaticamente
- Alternar visibilidade do painel com o botão ☰
Períodos Favoritos
- Linha de acesso rápido configurável via entrada separada por vírgulas (ex: m1, h1, D1)
- Suporta todos os tipos de período, incluindo Range e Tick
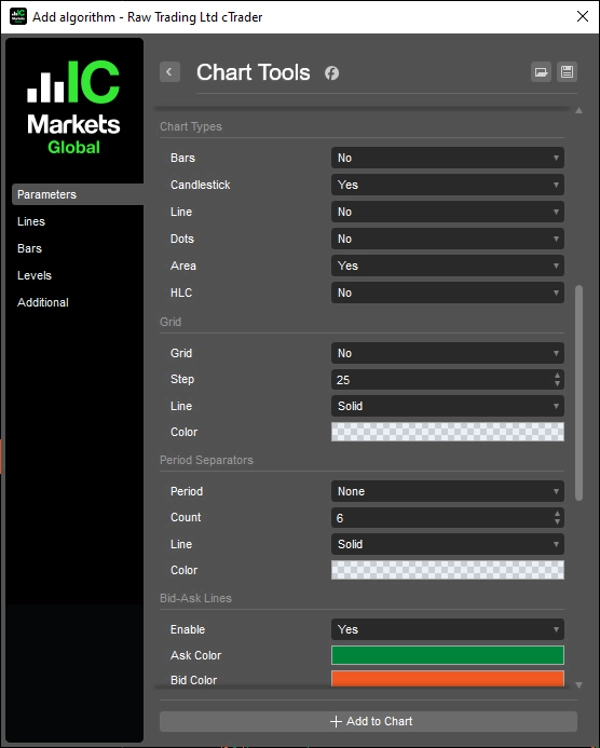
Tipo de Gráfico
- Botões de troca rápida para: Barras, Candlestick, Linha, Pontos, Área, HLC
- Tipo de gráfico ativo destacado automaticamente
- Cada botão configurável individualmente via parâmetros
Grade
- Grade baseada em números arredondados com intervalo de pip configurável (Multiplicador)
- Rótulos de preço com formatação decimal inteligente
- Linhas se estendem 10 barras além da última barra
- Alternar ativar/desativar
Separadores de Período
- Separadores Diários, Semanais, Mensais e Anuais
- Contagem, cor, estilo de linha e espessura configuráveis
- Atualização automática ao rolar e dar zoom
Linhas de Oferta/Demanda
- Linhas de oferta e demanda ao vivo que se estendem ao infinito
- Cores configuráveis para oferta e demanda
- Alternar ativar/desativar
Botões
- Posição: Superior Direito, Superior Esquerdo, Inferior Direito, Inferior Esquerdo
- Margem configurável
- Cores configuráveis dos botões e do texto — incluindo estado ativo, aplicar zoom e botão de alternância do gráfico
__________________________________________________________________________________________
MAIS INDICADORES GRATUITOS
Explore uma ampla gama de ferramentas de análise de mercado — desde estrutura e volume até regressão, volatilidade e períodos personalizados.
O código-fonte está disponível no repositório GitHub.
Todos gratuitos para uso. Mas se quiser enviar um suporte para café, você pode fazer isso aqui.
Suporte/Resistência
Volume
- Perfilador de Atividade de Volume
- Analisador de Eficiência de Volume
- Análise de Perfil de Volume
- Perfil de Volume - Atualizado
- Análise de Spread de Volume
- VWAP (Preço Médio Ponderado por Volume)
Médias Móveis
- Canal SSL
- Média Móvel Ancorada
- Média Móvel Escalada por Desvio
- Ativador Gann High Low
- Linha de Tendência Instantânea
- Média Móvel Adaptativa Kaufman com Visão de Tendência
- Canal de Média Móvel
- Conjunto de Médias Móveis
- Média Móvel do Canal de Tendência
Utilitários/Personalizados
Baseado em Regressão
Volatilidade
Osciladores
__________________________________________________________________________________________
AVISO LEGAL
Negociar envolve riscos. Este indicador destina-se apenas à análise técnica — sempre aplique uma gestão de risco adequada e negocie com responsabilidade.
FEEDBACK E MELHORIAS
Se você tiver sugestões, pedidos de recursos ou ideias para melhorias, por favor deixe um comentário na aba Discussão. Seu feedback ajuda a melhorar o indicador para todos.
Resumo
Users can configure a quick-access row of favorite timeframes supporting all timeframe types. The chart type switcher offers quick buttons for Bars, Candlestick, Line, Dots, Area, and HLC charts, each with individual configuration and automatic active state highlighting.
Additional features include a round numbers-based grid with configurable pip intervals and smart decimal formatting, daily to yearly period separators with customizable appearance, and live bid/ask lines extending indefinitely with color customization and toggle options.
The control panel’s buttons can be positioned in any corner of the chart with configurable margins and colors, including active states and zoom application. This tool aims to streamline active trading sessions by reducing time spent navigating native menus, supporting efficient technical analysis on various chart types and timeframes.
Avaliações de clientes
5 | 100 % | |
4 | 0 % | |
3 | 0 % | |
2 | 0 % | |
1 | 0 % |


