
الوصف
🚀 أكثر من 10,000 متداول يستخدمون بالفعل أفضل المؤشرات🏆
👉 احصل على جميع أنظمتنا الأفضل هنا:
_______________________________________________
📌 مؤشرات هيكل السوق
· ✅ هيكل السوق المتقدم: Bos, Choch, SwinLevels, كتل الأوامر، هيكل السوقوآداة العثور على السيولة
· 🔄 تحليل هيكل السوق الديناميكي لنقاط التحول
· 🧱 كتلة الأوامر
· ⚖️ اختلال السوق
· ⛓️ BOS & CHOCH
· 🧠 ICT قوة 3
_______________________________________________
🔚 أنظمة الخروج الذكية
_______________________________________________
📐 مؤشرات ZigZag
· ➖ ZigZag
_______________________________________________
🧱 مؤشرات الدعم والمقاومة
· 🟩 خطوط دعم ومقاومة SmartTrend
· 🧱 جميع مستويات الدعم والمقاومة
_______________________________________________
📊 مؤشرات الاتجاه والقناة
· 📊 سوبرتريند
· ⭐ قناة SSL المميزة
_______________________________________________
💧 أدوات الحجم والسيولة
· 📉 خريطة تصفية الرافعة المالية
_______________________________________________
⚡ مؤشرات الزخم و RSI
· 📈 مُشغل اتجاه RSI
· 🔎 تتبع ميل الشمعة متعددة المستويات
Tracker
_______________________________________________
🔮 أدوات التنبؤ والإسقاط
· 📐 التنبؤ بناءً على Linreg& ATR
· 📏 انحدار فيبوناتشي الخطي متعدد الأطر الزمنية
· 📈 عارض تدفق السوق المدعوم بالحجم
📊 كاشف اختراق المحور
🎯 **ما هو وما الغرض منه؟**
https://ctrader.chartshots.net/c/68e935cb9f52a
كاشف اختراق المحور هو مؤشر تقني متقدم مصمم لتحديد الاختراقات المهمة تلقائيًا من مناطق تماسك السعر. يقوم هذا المؤشر بتحليل سلوك السوق التاريخي لاكتشاف المناطق التي "ارتد" فيها السعر مرارًا وتكرارًا (مما يخلق مقاومة أو دعم) وينبهك عندما يحدث اختراق مع زخم أخيرًا.
**الفائدة الرئيسية:**
• تحديد فرص التداول في الاختراقات المؤكدة
• تجنب الاختراقات الكاذبة من خلال التحقق من اللمسات المتعددة
• تصور مناطق الدعم والمقاومة الديناميكية الحرجة
• التقاط الحركات الانفجارية بعد التماسك
________________________________________
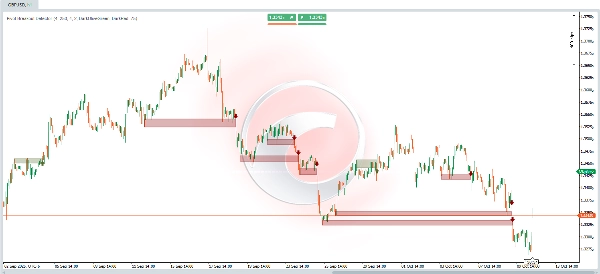
🔍 **كيف يعمل؟ - المنطق الأساسي**
**المرحلة 1: اكتشاف النقاط المحورية المهمة**
https://ctrader.chartshots.net/c/68e9368eb6e7c
يقوم المؤشر بمسح الرسم البياني باستمرار بحثًا عن نقاط محورية - القمم والقيعان المحلية التي تمثل أماكن تغير اتجاه السعر. هذه النقاط المحورية أساسية لأنها تحدد مستويات كان هناك فيها اهتمام من المشترين أو البائعين تاريخيًا.
**المرحلة 2: تحديد مناطق التماسك**
بمجرد اكتشاف النقاط المحورية، يقوم المؤشر بتجميع تلك القريبة من بعضها البعض (ضمن عتبة قابلة للتكوين). عندما تتركز عدة نقاط محورية في نطاق سعري ضيق، يشير ذلك إلى منطقة تماسك - وهي منطقة تم رفض السعر فيها مرارًا وتكرارًا.
**المرحلة 3: تأكيد الاختراق**
ينتظر المؤشر بصبر حتى يتمكن السعر من:
1. الإغلاق فوق (اختراق صعودي) أو تحت (اختراق هبوطي) المنطقة المحددة
2. القيام بذلك بشمعة اتجاهية قوية (إغلاق بعيد عن الافتتاح)
3. تجاوز أعلى/أدنى نقطة قصيرة الأجل حديثة
**المرحلة 4: التحقق النهائي**
قبل توليد الإشارة، يتحقق من:
• وجود عدد كافٍ من "اللمسات" السابقة في المنطقة (الحد الأدنى القابل للتكوين)
• عدم تجاوز السعر لهذا المستوى مؤخرًا
• افتتاح شمعة الاختراق ضمن النطاق الصالح
________________________________________
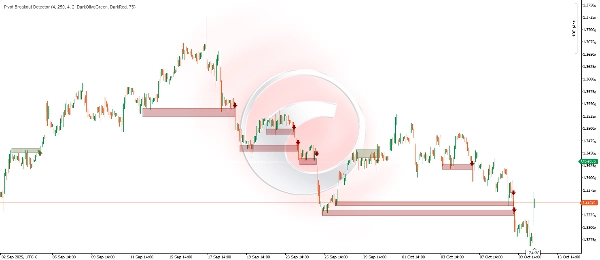
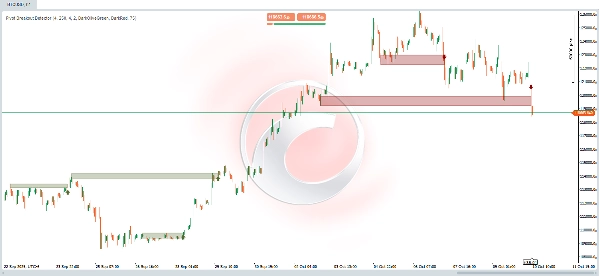
📈 **التفسير البصري**
**العناصر على الرسم البياني:**
🟢 **مستطيلات خضراء زيتونية (اختراق صعودي)**
• المنطقة الخضراء المظللة: تمثل منطقة المقاومة التي تم تجاوزها
• الحدود العليا والسفلى: تحدد منطقة التماسك السابقة
• الامتداد الأفقي: يوضح من متى تم تشكيل المنطقة حتى لحظة الاختراق
🔴 **مستطيلات حمراء داكنة (اختراق هبوطي)**
• المنطقة الحمراء المظللة: تمثل منطقة الدعم التي تم كسرها
• الوظيفة: مماثلة للمستطيلات الخضراء ولكن للحركات الهبوطية
⬆️ **سهم أخضر متجه للأعلى**
• الموقع: أسفل الشمعة التي أكدت الاختراق الصعودي
• المعنى: إشارة دخول محتملة طويلة (شراء)
• التفسير: السعر اخترق المقاومة بقوة
⬇️ **سهم أحمر متجه للأسفل**
• الموقع: فوق الشمعة التي أكدت الاختراق الهبوطي
• المعنى: إشارة دخول محتملة قصيرة (بيع)
• التفسير: السعر اخترق الدعم بقوة
________________________________________
⚙️ **المعلمات القابلة للتكوين**
1. **طول اكتشاف التأرجح (الافتراضي: 4)**
• ما يتحكم به: فترة التحليل لاكتشاف النقاط المحورية المهمة
• القيم المنخفضة (2-3): تكتشف نقاط محورية أصغر وأكثر تواترًا، تولد إشارات أكثر ولكن قد تكون أكثر كذبًا
• القيم العالية (7-10): تكتشف فقط النقاط المحورية الكبرى والأكثر موثوقية، تولد إشارات أقل ولكن بجودة أعلى
• التوصية: 4 للتداول اليومي، 8-10 للتداول المتأرجح
2. **أشرطة تاريخ المنطقة (الافتراضي: 250)**
• ما يتحكم به: عدد الشموع التي "يتذكر" المؤشر نقاط المحورية لتشكيل المناطق
• القيم المنخفضة (30-100): يركز على المناطق الحديثة، أكثر استجابة لتغيرات الهيكل
• القيم العالية (200-300): يأخذ في الاعتبار المناطق التاريخية الأقدم، مفيد لتحديد المستويات طويلة الأجل
• التوصية: 150-200 للأطر الزمنية داخل اليوم، 250-300 يوميًا أو أعلى
3. **نسبة عرض المنطقة (الافتراضي: 4%)**
• ما يتحكم به: سمك "منطقة التسامح" لتجميع النقاط المحورية في منطقة
• القيم المنخفضة (1-2%): مناطق دقيقة جدًا، تتطلب لمسات متعددة شبه متطابقة
• القيم العالية (5-8%): مناطق أوسع، أكثر تساهلًا عند تجميع المستويات القريبة
• التوصية: 2-3% للأدوات ذات التقلب المنخفض (رؤوس أزواج العملات)، 4-6% للعملات المشفرة
4. **الحد الأدنى لعدد لمسات التأرجح (الافتراضي: 2)**
• ما يتحكم به: الحد الأدنى لعدد المرات التي يجب أن "يختبر" فيها السعر المنطقة قبل اعتبارها صالحة
• القيم المنخفضة (1-2): إشارات أكثر، بما في ذلك المناطق الأقل تأسيسًا
• القيم العالية (3-5): فقط المناطق المؤكدة بقوة، إشارات أقل ولكن أكثر موثوقية
• التوصية: 2 للتداول النشط، 3-4 للمراكز الأكثر تحفظًا
________________________________________
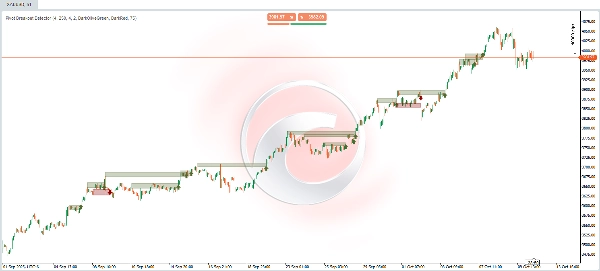
📊 **أمثلة عملية**
🔵 **مثال على اختراق صعودي**
**السياق السابق:** كان السعر يتأرجح لعدة جلسات بين 48.50 دولار و49.20 دولار. خلال فترة التماسك هذه، حاول السعر تجاوز مستوى 49.00 دولار في ثلاث مناسبات مختلفة، لكن تم رفضه في كل مرة، مما خلق نقاط محورية عالية عند نفس المستوى تقريبًا.
**تشكيل المنطقة:** يحدد المؤشر تلقائيًا هذه النقاط المحورية الثلاثة العالية المركزة بين 48.90 دولار و49.10 دولار، مما يخلق "منطقة مقاومة" محددة جيدًا. يتم رسم هذه المنطقة كمستطيل أخضر زيتوني شفاف يمتد أفقيًا من اللمسة الأولى حتى الوقت الحالي.
**لحظة الاختراق:** في الجلسة الحالية، يفتح السعر عند 48.80 دولار، يرتفع بقوة ويغلق عند 49.35 دولار. تلبي هذه الشمعة جميع المعايير:
• ✅ يغلق فوق منطقة المقاومة (49.10 دولار)
• ✅ هي شمعة صعودية قوية (الإغلاق أعلى بكثير من الافتتاح)
• ✅ يتجاوز أعلى نقطة من آخر 4 شموع سابقة
• ✅ كانت المنطقة تحتوي على 2-3 لمسات مؤكدة على الأقل
**الإشارة المولدة:** يظهر سهم أخضر يشير للأعلى أسفل شمعة الاختراق، ويُغلق المستطيل الأخضر الزيتوني في تلك اللحظة، مما يعرض بصريًا الهيكل الكامل: من مكان تكوين المقاومة إلى مكان كسرها.
**تفسير المتداول:** هذه إشارة شراء محتملة. يشير الاختراق إلى أن المشترين تغلبوا أخيرًا على المقاومة التي كانت تحجز السعر، وقد يبدأ تحرك صعودي أكثر استدامة. قد يفكر المتداولون في:
• دخول طويل عند إغلاق الشمعة أو عند ارتداد إلى المنطقة المكسورة (التي أصبحت دعمًا الآن)
• وقف خسارة تحت المنطقة (48.70 دولار)
• هدف بناءً على ارتفاع المنطقة المتوقع صعودًا
________________________________________
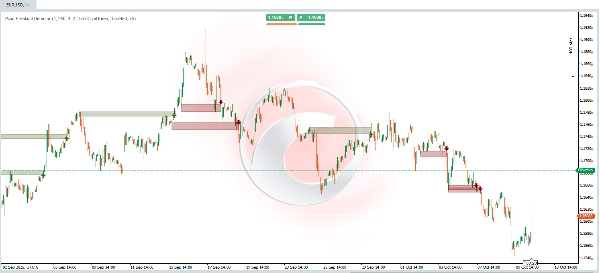
🔴 **مثال على اختراق هبوطي**
**السياق السابق:** كان السعر في مرحلة توزيع حول 102.00 دولار لما يقرب من أسبوعين. في أربع مناسبات مختلفة، حاول السعر الهبوط تحت 101.50 دولار لكن تم إنقاذه من قبل المشترين، مما خلق نقاط محورية منخفضة في منطقة ضيقة جدًا.
**تشكيل المنطقة:** يكتشف المؤشر هذه النقاط المحورية المنخفضة الأربعة المجمعة بين 101.40 دولار و101.70 دولار، محددًا "منطقة دعم" مؤسسية واضحة. يتم تمييز المنطقة بمستطيل أحمر شفاف يوثق التاريخ الكامل للدفاع عند هذا المستوى.
**لحظة الاختراق:** خلال جلسة متقلبة، يفتح السعر عند 101.80 دولار، تؤثر أخبار سلبية على السوق، وينهار السعر ليغلق عند 100.95 دولار. تعرض شمعة الاختراق هذه:
• ✅ يغلق بوضوح تحت منطقة الدعم (101.40 دولار)
• ✅ هي شمعة هبوطية قوية (الإغلاق أسفل بكثير من الافتتاح)
• ✅ يكسر أدنى نقطة من آخر 4 جلسات
• ✅ تم اختبار الدعم 4 مرات سابقًا
**الإشارة المولدة:** يظهر سهم أحمر يشير للأسفل فوق شمعة الاختراق. يكتمل المستطيل الأحمر الداكن، موثقًا بصريًا فترة التكوين الكاملة ونقطة انهيار الدعم بالضبط.
**تفسير المتداول:** هذه إشارة بيع محتملة. يشير الاختراق إلى أن البائعين كسروا أخيرًا الأرضية التي كانت تدعم السعر، مما يوحي بأن الاتجاه الهبوطي قد يستمر. تشمل الاعتبارات:
• دخول قصير عند الإغلاق أو عند ارتداد فاشل إلى المنطقة المكسورة (التي أصبحت مقاومة الآن)
• وقف خسارة فوق المنطقة (102.00 دولار)
• هدف محسوب من خلال إسقاط ارتفاع المنطقة للأسفل
________________________________________
💡 **نصائح الاستخدام**
✅ **أفضل الممارسات:**
1. التأكيد بالحجم: عادةً ما تصاحب الاختراقات الحقيقية زيادة في الحجم
2. سياق الاتجاه: الاختراقات في اتجاه الاتجاه الرئيسي لها احتمال نجاح أعلى
3. وقت الانتظار: ليس كل الإشارات يجب تداولها فورًا؛ انتظر تأكيدًا إضافيًا إذا لزم الأمر
4. إدارة المخاطر: استخدم دائمًا وقف خسارة بناءً على هيكل المنطقة المكسورة
الملخص
Key features include:
- Automatic detection of significant pivot points and consolidation zones.
- Breakout confirmation based on candle strength and price action.
- Validation requiring multiple prior touches of the zone to reduce false signals.
- Visual cues on the chart: olive green rectangles and upward arrows for bullish breakouts; dark red rectangles and downward arrows for bearish breakouts.
- Configurable parameters such as swing detection length, zone history depth, zone width, and minimum touches to tailor sensitivity and reliability.
The indicator supports various markets including Forex, cryptocurrencies, stocks, and major symbols like BTCUSD, EURUSD, GBPUSD, XAUUSD, and NAS100. It aids traders in spotting confirmed breakout opportunities, visualizing critical price levels, and managing risk with structural stop-loss placement.


