
Description
Cet ALGORITHME est un outil technique avancé 🔧 conçu pour automatiser la détection des motifs de prix géométriques (Motifs Harmoniques) et des structures de marché basées sur l'action des prix. Son objectif principal est d'identifier des zones potentielles de retournement de tendance à haute probabilité 📍.
https://chartshots.spotware.com/c/693330cd99c57
Que fait cet algorithme ?
L'algorithme analyse le graphique en temps réel 🔍 à la recherche de formations de prix spécifiques. Il fonctionne sur deux niveaux :
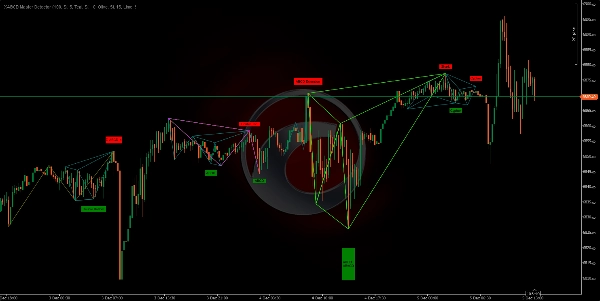
- Cartographie de la structure (ZigZag) : Tout d'abord, il simplifie le bruit du marché en traçant des lignes "ZigZag" reliant les hauts et bas pertinents (pivots). Il utilise jusqu'à 4 longueurs différentes simultanément 📏 pour capturer à la fois les tendances petites (court terme) et grandes (long terme).
- Reconnaissance de motifs : Une fois ces points pivots (points A, B, C, D, X) identifiés, l'algorithme mesure les distances et les ratios entre eux. Si ces ratios correspondent aux règles mathématiques des motifs classiques de trading (comme Fibonacci), l'indicateur dessine le motif et alerte l'utilisateur 🚨.
À quoi sert-il ?
Il sert à éliminer la subjectivité lors du tracé de motifs complexes et gagner du temps d'analyse ⏳. Au lieu de mesurer manuellement chaque retracement et extension de Fibonacci, l'indicateur le fait automatiquement pour :
- Détecter les retournements : Trouver les points où le prix pourrait tourner (de haussier à baissier ou inversement). 🔄
- Identifier les points d'entrée : Signaler des zones précises (la "Zone Potentielle de Renversement") pour entrer sur le marché. 🎯
- Confirmer l'analyse : Servir de confluence supplémentaire à votre propre stratégie de support/résistance.
Logique derrière les calculs
Le cœur de l'indicateur est basé sur les ratios de Fibonacci et la symétrie du marché ⚖️. L'algorithme vérifie des règles strictes pour chaque motif. Par exemple, pour confirmer un motif "Gartley", l'algorithme calcule en interne :
- Si le retracement du point B par rapport à la jambe XA est exactement (ou très proche de) 0.618.
- Si la projection du point D respecte des proportions spécifiques.
L'indicateur autorise une petite marge d'erreur (configurable) car le marché est rarement parfait au pip près. Il calcule également le ratio Risque/Rendement théorique avant d'afficher un motif.
Motifs détectés :
https://chartshots.spotware.com/c/6933314cb9fa1
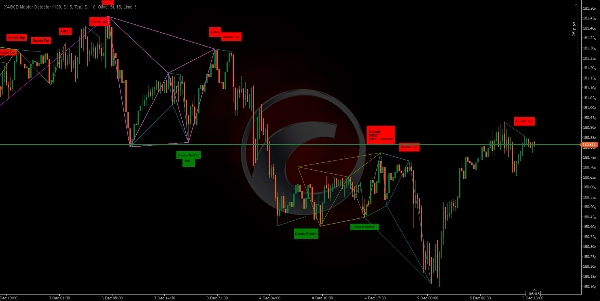
- Classiques : Double Top et Double Bottom. 🏔️🏞️
- Harmoniques : Gartley, Bat 🦇, Butterfly 🦋, Crab 🦀, Deep Crab, Shark 🦈, Cypher.
- Structures ABCD : ABCD classique, AB=CD, ABCD étendu.
- Exotiques : Three Drives, 5-0.
https://chartshots.spotware.com/c/6933317ae4324
Comment l'utiliser ?
Configuration visuelle :
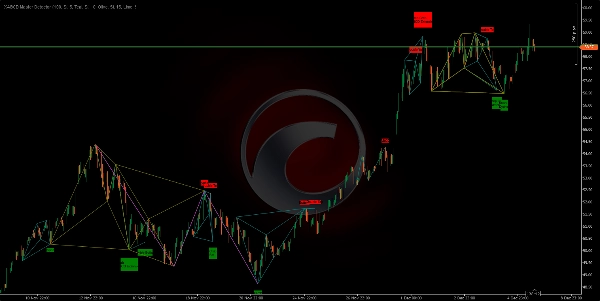
- Vous verrez des lignes colorées reliant les sommets et creux.
- Lorsqu'un motif est complet, une figure géométrique colorée et une étiquette avec le nom du motif (ex. "Gartley", "Double Top") apparaîtront.
- Étiquettes vertes : Indiquent des motifs haussiers (chercher des achats). 📈
- Étiquettes rouges : Indiquent des motifs baissiers (chercher des ventes). 📉
Interprétation :
- Ne tradez pas chaque étiquette aveuglément. Utilisez-la comme un signal d'alerte.
- Quand un motif apparaît, attendez que le prix réagisse dans la zone D (le dernier point du motif).
- Cherchez une confirmation supplémentaire (comme une bougie de retournement japonaise ou une divergence RSI) avant d'entrer.
Réglages clés :
- Vous pouvez activer ou désactiver des motifs spécifiques si vous préférez n'en trader que certains (ex. seulement "Bat" et "Gartley"). ✅
- Vous pouvez ajuster la sensibilité des ZigZags pour voir des mouvements plus rapides ou des tendances plus lentes. ⚙️
🏆 Plus de 10 000 traders font confiance à notre suite de plus de 25 algorithmes ! 🏆
De la structure de marché & liquidité aux systèmes de sortie intelligents & outils prédictifs - nous avons construit TOUS les outils dont vous avez besoin pour être constant.
👉 Accédez à tous les 25+ systèmes PROUVÉS :
_______________________________________________
📌 Indicateurs de structure de marché
· ✅ AdvancedMarket Structure: Bos, Choch, SwinLevels, Order Blocks, Market Structure& Liquidity Finder
· 🔄 Analyse dynamique de la structure de marché des points de retournement
· 🧱 Order Block
· ⚖️ Market Imbalance
· ⛓️ BOS & CHOCH
· 🧠 ICT Power of 3
_______________________________________________
🔚 Systèmes de sortie intelligents
· 📍 Algorithme intelligent de suivi
_______________________________________________
📐 Indicateurs ZigZag
· 🔍 Projection de liquidité des prix ZigZag
· ➖ ZigZag
· 🎯 Traceur d'extrémité Zig-Zag
_______________________________________________
🧱 Indicateurs de support & résistance
· 🟩 Lignes de support & résistance SmartTrend
· 🧱 Tous les niveaux de support et résistance
_______________________________________________
📊 Indicateurs de tendance & canal
· 🔄 Canal de tendance automatique
· 📊 Supertrend
· ⚡Analyseur de tendance Momentum
· 🧠 Canal de tendance adaptatif
· 💥 Système de cassure de canal
· 🌈 Gradient de tendance dynamique
_______________________________________________
💧 Outils de volume & liquidité
· 🔥 Carte thermique du volume POC
· 📉 Carte de liquidation des leviers
· 🕒 Sessions de Fair Value Gap
_______________________________________________
⚡ Indicateurs Momentum & RSI
· 📈 Déclencheur de tendance RSI
· 🚀 Momentum de plage dynamique
· 🔎 Suivi du biais de bougie multi-niveaux
Tracker
_______________________________________________
🔮 Outils de prédiction & projection
· 📐 Prédiction basée sur Linreg & ATR
· 📏 Régression linéaire Fibonacci multi-échelle
· 📈 Projecteur de flux de marché alimenté par le volume_________________________
_________________________________________________________________________________________________
_________________________________________________________________________________________________
DÉCLENCHEUR DE CANAL RSI : 📶
Qu'est-ce que c'est : Un indicateur qui calcule le RSI(période) et marque visuellement les zones de momentum lorsque le RSI franchit les seuils de surachat/survente (par défaut 70/30). ✅
https://chartshots.spotware.com/c/69278f8b6d973
Logique : Lorsqu'un seuil est franchi, il crée une "zone" basée sur le plus haut/le plus bas de la bougie au moment du croisement. Ensuite : 🧠
- Colore les bougies à l'intérieur de cette zone.
- Trace un canal (haut, bas, milieu).
- Marque le croisement sur le panneau RSI avec un cercle et une étiquette.
La zone dure exactement MinZoneDuration barres. ⏱️
Signaux clairs :
- Croisement au-dessus du surachat → initie une zone haussière. 🟢
- Croisement en dessous du survente → initie une zone baissière. 🔴
La zone elle-même est une zone d'intérêt, pas un ordre.
https://chartshots.spotware.com/c/69278fb274e0b
Comment l'utiliser (rapidement) :
- Attendez que la zone se forme. 🎯
- Confirmez avec l'action des prix (cassure/rejet des lignes du canal).
- Entrez avec un stop loss en dehors de la zone et un objectif à la ligne médiane du canal ou un ratio Risque/Rendement défini.
https://chartshots.spotware.com/c/69278fe76237b
Paramètres clés : ⚙️
- Période RSI (14)
- Surachat (70)
- Survente (30)
- MinZoneDuration (15)
- Couleurs configurables 🎨
Résumé
The algorithm recognizes classic and complex patterns—including Double Top/Bottom, Gartley, Bat, Butterfly, Crab, Deep Crab, Shark, Cypher, ABCD structures, and exotic patterns like Three Drives and 5-0—by measuring distances and Fibonacci ratios between pivot points. Upon pattern completion, it visually displays colored geometric figures and labels indicating bullish (green) or bearish (red) signals.
Users can customize pattern detection and ZigZag sensitivity to suit their trading preferences. The indicator supports various markets such as Forex, commodities, indices, stocks, and cryptocurrencies, including symbols like EURUSD, GBPUSD, BTCUSD, XAUUSD, NAS100, and USDJPY.
XABCD Master Detector aims to reduce subjectivity and save analysis time by automatically calculating Fibonacci retracements, extensions, and theoretical risk/reward ratios. It serves as an alert tool to detect reversals, identify entry points, and provide additional confluence to existing support/resistance strategies.
Avis clients
5 | 100 % | |
4 | 0 % | |
3 | 0 % | |
2 | 0 % | |
1 | 0 % |


![Logo de "[Stellar Strategies] Market Session Ultimate"](https://cdn.ctrader.com/image/webp/61ffd537-0125-4246-9e72-42eca1791d64_28232)


