
Momentum Trend Analyzer
指标
180 下载
版本 1.0, Aug 2025
Windows 版、Mac 版
说明
🚀 已有超过10,000名交易者使用我们的顶级指标 🏆
了解为什么专业人士选择我们——cTrader上最强大的工具(指标、算法和cBots)正等着您。
👉 在这里获取我们所有的顶级系统:
📌 市场结构指标
- ✅ 高级市场结构:Bos、Choch、SwinLevels、订单区块、市场结构与流动性发现器
- 🔄 转折点的动态市场结构分析
- 🧱 订单区块
- ⚖️ 市场失衡
- ⛓️ BOS 与 CHOCH
- 🧠 ICT 三力合一
- 🌀 市场极性区域
🔚 智能退出系统
- 📍 智能跟踪算法
📐 之字形指标
- 🔍 之字形价格流动性投影
- 🧭 支撑与阻力结构之字形
- ➖ 之字形
- 🎯 之字形极端追踪器
🧱 支撑与阻力指标
📊 趋势与通道指标
💧 成交量与流动性工具
⚡ 动量与RSI指标
🔮 预测与投影工具
动量趋势分析器 🚀📊
一款先进的技术算法,旨在识别 市场趋势方向 并评估其 强度,整合多种分析指标。该指标结合了 指数移动平均线(EMA)、 变化率(RoC)、 波动率、 相对强弱,以及 成交量,以提供清晰且可操作的信号。以下是其功能及计算逻辑的详细解析。
关键组成部分 🔧
该算法基于 五个核心元素 协同工作:
- 指数移动平均线(EMA) 📈
-
- 使用 四条不同周期的EMA:超快、快速、中等和慢速——通常基于收盘价计算。
- 短期EMA(超快和快速)检测 即时价格变动,而长期EMA(中等和慢速)反映 持续趋势。
- 变化率(RoC) ⚡
-
- 衡量特定时期内的 价格百分比变化,作为直接的动量指标。
- 平滑的RoC 过滤小幅波动,稳定信号。
- 归一化平均真实波幅(ATR) 🌪️
-
- ATR量化 历史波动率,通过除以当前价格进行归一化以便相对评估。
- 高归一化ATR 表示波动性增加,影响趋势强度的解读。
- 相对强弱指数(RSI) 💪
-
- 该振荡器测量价格变动的 幅度和速度,识别超买/超卖状态。
- 帮助评估趋势中的 动量强度。
- 平均成交量 🔊
-
- 成交量的简单移动平均线检测 高活跃期,增强信号的有效性。
计算逻辑 🧠
动量趋势分析器 通过特定条件和计算组合生成趋势和强度信号:
1. 趋势判定
- 🟢 多头趋势:当快速EMA > 中期EMA,中期EMA > 慢速EMA,且收盘价 > 快速EMA时确认。
- 🔴 空头趋势:当快速EMA < 中期EMA,中期EMA < 慢速EMA,且收盘价 < 快速EMA时确认。
- ⚪ 中性趋势:当以上条件均不满足时,表示 盘整或犹豫。
2. 早期趋势信号 🔍
- 检测 潜在趋势转变,在完全确认前使用:
-
- 超快EMA
- 快速EMA斜率
- 平滑RoC
- 示例:当超快EMA上穿快速EMA,快速EMA斜率为正,且平滑RoC超过动量阈值时,触发 早期多头信号。
3. 灵敏度调整 ⚖️
提供三种模式:
- 🛡️ 保守型:优先确认信号,减少误报(检测较慢)。
- ⚔️ 激进型:偏好早期信号以快速响应(风险较高)。
- ⚖️ 平衡型:折中方案。
4. 趋势强度计算 💯
强度来源于对以下因素的 加权整合:
- EMA差距:快速与慢速EMA之间的距离(百分比)。
- RSI贡献:RSI与50的差值(多头/空头)。
- 波动率(归一化ATR):根据市场波动调整强度。
- 相对成交量:当前成交量大于平均时,强度增加。
- 动量(平滑RoC):衡量运动速度。
- 结果:一个 强度百分比(0%-100%)——数值越高,趋势越强劲。
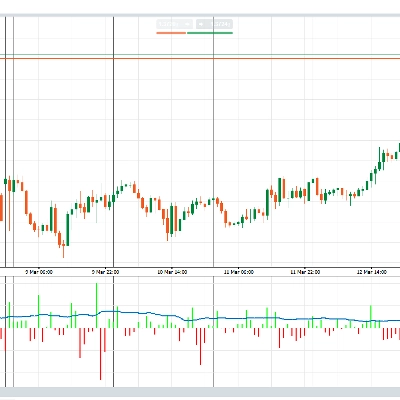
5. 动态通道 🎯
- 基于近期价格高点/低点的三条上下通道线。
- 作为 动态支撑/阻力水平,随市场波动调整。
交易者的实际应用 💼
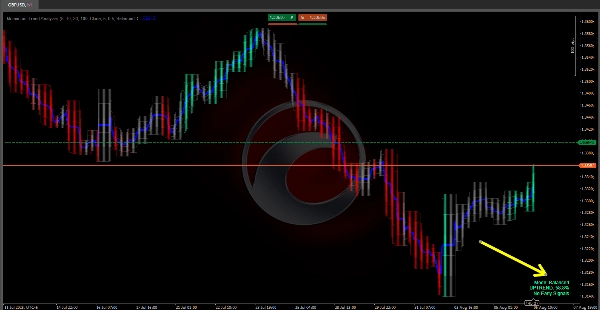
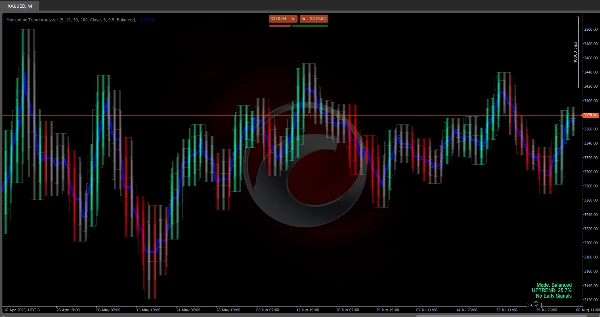
- 📊 可视化:通过彩色阴影显示趋势(🟢 多头,🔴 空头,⚪ 中性)+ 趋势线。
- 💪 强度:百分比数值(例如,24.3% = 谨慎;>50% = 高信心)。
- 🔄 通道策略:
-
- 多头:在下通道买入,上通道卖出。
- 空头:在上通道卖出,下通道回补。
- 🚨 早期信号:帮助激进交易者预判快速变化的市场。
- 🛠️ 灵活性:灵敏度模式适应 保守(等待确认)或 激进(提前行动)风格。
结论 🎯
动量趋势分析器 通过结合EMAs、RoC、归一化ATR、RSI和成交量,提供全面的趋势和动量分析。其基于明确条件和加权因素的计算逻辑,适应 不同风险水平和交易策略,使其成为交易者的强大工具。
摘要
AI 摘要
Momentum Trend Analyzer is a technical indicator designed to identify market trend direction and assess its strength by integrating multiple analytical metrics. It combines four exponential moving averages (EMAs) with distinct periods (ultra-fast, fast, medium, slow), rate of change (RoC), normalized average true range (ATR), relative strength index (RSI), and average volume to generate clear trend and momentum signals.
The indicator determines bullish, bearish, or neutral trends based on EMA relationships and price positioning. It provides early trend shift signals using ultra-fast EMA, fast EMA slope, and smoothed RoC. Users can select from three sensitivity modes—conservative, balanced, and aggressive—to adjust signal responsiveness according to their trading style.
Trend strength is calculated as a weighted integration of EMA spread, RSI deviation from neutral, normalized volatility, relative volume, and momentum, expressed as a percentage from 0% to 100%. The indicator also features dynamic bands derived from recent price highs and lows, serving as adaptive support and resistance levels.
Visualization includes colored shading to indicate trend direction and a trendline, with strength values aiding decision-making. The band strategy suggests buying near lower bands and selling near upper bands in bullish trends, and the reverse in bearish trends. This tool supports diverse risk levels and trading strategies by providing comprehensive trend and momentum analysis.
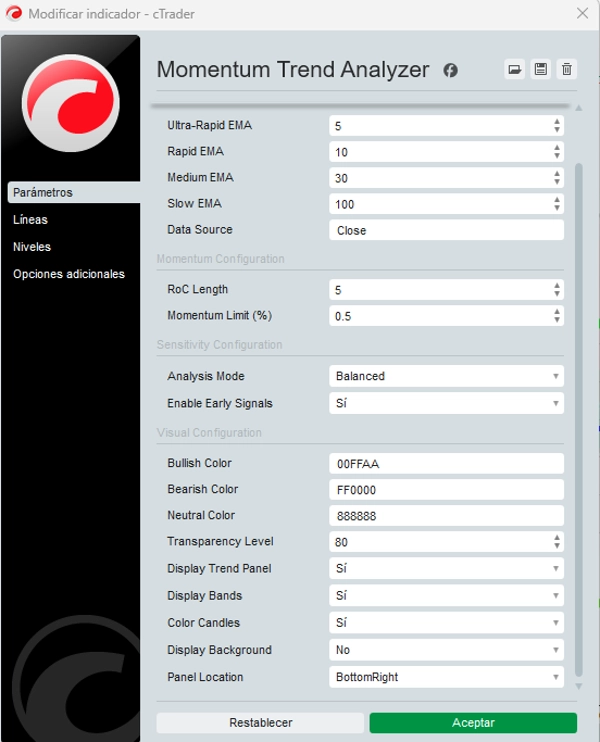
指标配置
客户评价
0.0
评价:0
客户评价
该产品尚无评价。已经试过了?抢先告诉其他人!
讨论
常见问答
cTrader Store 提供的所有产品,包括交易机器人、指标和插件,均由第三方开发者提供,仅供信息参考和技术访问之用。cTrader Store 并非经纪商,不提供投资建议、个人推荐或任何未来业绩保证。


价格
注册日期 03/10/2024
163
销售
38.55K
免费安装