الوصف
▁▂▃▄▅▆▇ █ أكثر من 10,000 متداول (مؤسسي + تجزئة) █ ▇▆▅▄▃▂▁
- اختر مؤشراتنا الأعلى في cTrader 🏆
- ✨ دقة حصرية لنتائج متفوقة ✨
- 📈 خوارزمياتنا — مع أفضل المرئيات تقييمًا 🎯—
- تم تنفيذها بنجاح في صندوقين كميين
▁▂▃▄▅▆▇ █████████████████████████████ ▇▆▅▄▃▂▁
_______________________________________________
_______________________________________________
📌 مؤشرات هيكل السوق
· ✅ هيكل السوق المتقدم: Bos, Choch, SwinLevels, كتل الأوامر، هيكل السوقوآداة العثور على السيولة
· 🔄 تحليل هيكل السوق الديناميكي لنقاط التحول
· 🧱 كتلة الأوامر
· ⚖️ اختلال السوق
· ⛓️ BOS & CHOCH
· 🧠 قوة ICT 3
______________________________________________________________-
تخزين cBots : 🧠 اختراق الذهب و BTCمحاور الجلسة 🧠
_______________________________________________
🔚 أنظمة الخروج الذكية
_______________________________________________
📐 مؤشرات ZigZag
· ➖ ZigZag
_______________________________________________
🧱 مؤشرات الدعم والمقاومة
· 🟩 خطوط دعم ومقاومة SmartTrend
· 🧱 جميع مستويات الدعم والمقاومة
_______________________________________________
📊 مؤشرات الاتجاه والقناة
· 📊 سوبرتريند
· ⭐ قناة SSL المميزة
_______________________________________________
💧 أدوات الحجم والسيولة
· 📉 خريطة تصفية الرافعة المالية
_______________________________________________
⚡ مؤشرات الزخم و RSI
· 📈 مُشغل اتجاه RSI
· 🔎 متعقب تحيز الشمعة متعددة المستويات
_______________________________________________
🔮 أدوات التنبؤ والإسقاط
· 📐 التنبؤ بناءً على Linreg& ATR
· 📏 انحدار فيبوناتشي الخطي متعدد الأطر الزمنية
· 📈 عارض تدفق السوق المدعوم بالحجم
______________________________________________________________________________________________________
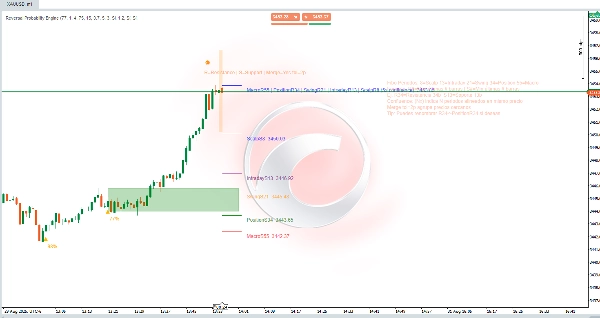
محرك احتمالية الانعكاس 🔄
مؤشر هجين لاكتشاف مناطق الانعكاس + رسم خرائط متعددة الأبعاد لمستويات الدعم والمقاومة "المستويات الذهبية". يجمع بين تحليل الهيكل (ارتفاعات/انخفاضات نافذة فيبوناتشي)، الديناميكيات (سرعة السعر وتسارعه)، الإنتروبيا/الفوضى (النظام مقابل العشوائية)، الزخم، والحجم لتوليد:
- مستويات الدعم/المقاومة الهرمية حسب أفق الزمن.
- إشارات احتمالية للانعكاس المحتمل (القمم والوديان) مع نسبة ثقة %. ⚠️
- مناطق نشطة (مستطيل) لوضع السياق للصفقات ووقف الخسائر.
- تجمعات التقاء (عندما تتزامن أطر زمنية متعددة عند نفس السعر). 🎯
2. الهدف
تقليل الضوضاء البصرية وتسهيل اتخاذ القرار من خلال تحديد:
- مكان ضغط السعر أو تثبيته عبر آفاق زمنية مختلفة.
- مكان زيادة الاحتمالية الإحصائية للانعكاس (مؤكد أو متوقع). 📊
- أي المستويات لها "وزن" أكبر (التقاء).
3. المنطق المفاهيمي
a) المستويات: لكل نافذة فيبوناتشي، يتم أخذ القمة الأخيرة (R) والقاع الأخير (S)؛ هذا يوفر مقياسًا فراكتاليًا للسياقات (قصير جدًا إلى ماكرو).
b) الدمج: إذا وقعت عدة مستويات مميزة ضمن X نقاط، يتم تجميعها → تجمع مع تسمية مشتركة وعدد التقاء.
c) إشارات الانعكاس: يتم البحث عن أنماط الإرهاق المحلية (شكل الموجة)، التباطؤ (تغير الميل)، انخفاض الإنتروبيا (الإنتروبيا المنخفضة = حركة أكثر اتجاهية مهيأة للانعكاس)، احتمالات التباعد الداخلي، والتحقق من الزخم/الحجم.
d) الوضع التنبؤي: يسمح بتوقع الانعكاسات (الماس) قبل التأكيد الكامل إذا تزامن التسارع المعاكس + الإنتروبيا المنخفضة + الحالة القصوى. 💎
e) الاحتمالية: توزيع الوزن الموحد لعوامل مختلفة (الاتجاه، الفوضى، الزخم، الحجم، التباعد، التكيف). النتيجة مقطوعة بين 40–99%.
f) المنطقة النشطة: بعد الإشارة، يتم البحث عن النطاق الأكثر منطقية (بين المستويات ذات الصلة) لإدارة الصفقة ووضع سياق لوقف الخسائر.
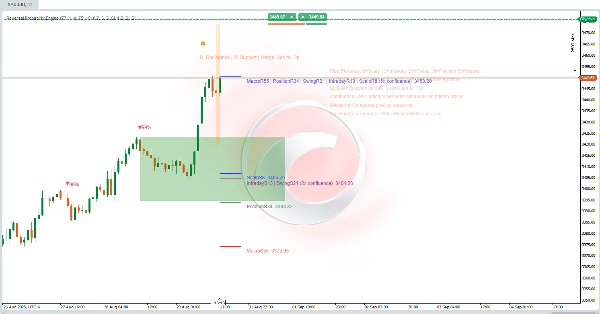
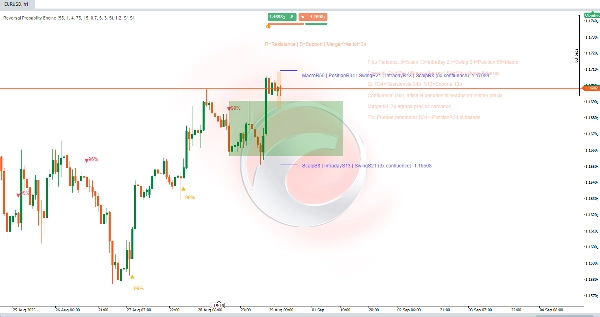
4. المكونات البصرية
- الخطوط الأفقية: المستويات حسب الفترة (Scalp 8، Intraday 13، Swing 21، Position 34، Macro 55). لون متناسق لكل أفق.
- تسميات R#/S#: R = مقاومة (القمة الأخيرة لتلك النافذة)، S = دعم (القاع الأخير). مثال: R34 = مقاومة مشتقة من آخر 34 شمعة.
- التسميات المدمجة:
ScalpS8 | IntradayS13 | … (5x confluence) Price. تشير إلى أن N فترات مميزة تعطي نفس المستوى (أو ضمن التسامح). كلما زاد العدد، زادت الأهمية. ✅ - (Nx confluence): عدد الفترات المتزامنة.
- تسامح الدمج tol=Xp: التسامح بالنقاط الذي يجمع المستويات القريبة (لتجنب التشبع).
- الاحتمالات (%): نص فوق/تحت المثلثات (أسفل / أعلى) أو الماس (الكشف المبكر).
- المستطيل الأخضر (المنطقة النشطة): قناة تشغيلية ديناميكية حيث يتم تقييم تطور ما بعد الإشارة.
- كتل/ألوان إضافية دقيقة: عناصر الدعم (موجات/جسيمات) إذا تم تفعيلها.
5. التفسير العملي
- التقاء عالي (≥3x) = مستوى "مغناطيسي" قوي أو محور؛ راقب رد فعل السعر. 🧲
- الإشارة + التقاء قريب يعزز الصلاحية (لكن لا يضمنها).
- الاحتمالية ≥ الحد الأدنى للثقة %: فلتر أدنى للنظر في الإجراء.
- تمييز المتوقع (الماس) مقابل المؤكد (المثلث): التوقع يقدم مخاطرة/مكافأة أفضل، ومعدل خطأ أعلى؛ المؤكد يأتي مع عدم تماثل أقل ولكن تحقق أكبر.
- المستطيل: إذا بقي السعر داخله ولم يلغي الحافة المقابلة، تظل الفرضية حية؛ الاختراق النظيف يقلل التوقع.
- توسيع أو تقليل تسامح الدمج: أصغر = دقة أكبر، أكبر = تجمعات أكثر تلخيصًا.
6. سير الاستخدام
- قم بتحميل المؤشر على الأداة والإطار الزمني المطلوب.
- اضبط الحد الأدنى لنسبة الثقة حسب التسامح (مثلاً، أقل للتداول السريع، أعلى للتأرجح).
- تحقق مما إذا ظهر تجمع دعم/مقاومة متعدد (5x، 4x، إلخ).
- انتظر إشارة (مثالية إذا ظهرت على محيط التجمع وباحتمالية عالية). 🔔
- حدد الإدارة ضمن المنطقة النشطة: دخول متدرج أو تأكيد فشل الاختراق.
- حدد وقفًا منطقيًا: خارج أول مستوى أدنى (في الشراء) أو أعلى (في البيع) غير موجود في التقاء.
- قم بإلغاء تفعيل الفترات التي لا تستخدمها (مثلاً، فقط Swing/Macro للمراكز الطويلة).
- اضبط التسامح، وخيارياً، أخفِ اللوحة التوضيحية بعد التعلم.
7. مثال سريع لقراءة التسمية
ScalpS8 | IntradayS13 | SwingS21 | PositionS34 | MacroS55 (5x confluence)
المعنى: جميع الأطر الزمنية (8–55) تشترك في نفس القاعدة → دعم هيكلي متعدد المقاييس. احتمال أعلى للرد؛ إذا فقد مع الحجم، فهذا يعني تغيير نظام أكثر جدية. 🚨
الملخص
Key features include:
- Hierarchical support and resistance levels categorized by time horizons (from ultra-short scalp to macro scales).
- Probabilistic reversal signals indicating potential peaks and valleys with confidence percentages.
- Active zones displayed as rectangles to help contextualize trade entries and stop placements.
- Confluence clusters that highlight price levels confirmed across multiple timeframes, enhancing level significance.
The indicator reduces visual noise by grouping nearby levels within a tolerance range and provides clear visual components such as horizontal lines, labeled resistance/support points, merged confluence labels, probability percentages, and active zones. It distinguishes between anticipated and confirmed reversal signals, offering traders options for risk management and trade timing.
Users can adjust confidence thresholds and merge tolerances to tailor granularity and filtering according to their trading style and timeframe. The tool supports structured decision-making by identifying statistically significant reversal areas and multi-scale support/resistance clusters on any instrument and timeframe.
تقييمات العملاء
5 | 0 % | |
4 | 0 % | |
3 | 0 % | |
2 | 0 % | |
1 | 100 % |