Description
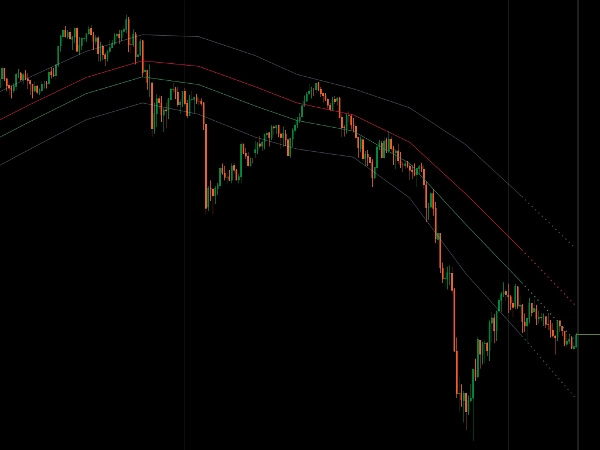
Canal de prix dynamique utilisant des moyennes mobiles sur les quatre prix OHLC pour une analyse complète de la structure du marché.
Applique votre type de MM choisi (Simple, Exponentielle, Wilder, Échelle de déviation, SuperSmoother, Hull) aux limites Haut/Bas, au biais directionnel Ouverture/Fermeture, et à la ligne d'équilibre Médiane pour une visualisation cohérente du canal.
Zones de reversion Fibonacci intégrées (38,2 %, 61,8 %), double couche de lissage pour SMA/EMA créant des canaux ultra-propres, affichage multi-échelles avec modes traditionnels en escalier ou lignes de tendance diagonales, projections intelligentes basées sur le momentum, et détection de rejet des limites fournissent une structure complète du canal pour les traders ciblant la réversion à la moyenne et l'évaluation de la force de la tendance à travers les échelles de temps.
FONCTIONNALITÉS
Structure complète des prix
- Haut/Bas définissent les limites du canal
- Ouverture/Fermeture montrent le biais directionnel
- Ligne médiane : niveau à 50 % entre Haut/Bas — le véritable centre de l'équilibre du marché
- Quatre prix travaillant ensemble pour montrer une image complète du marché
Zones de reversion intégrées
- Les niveaux Fibonacci 38,2 % et 61,8 % marquent des zones de retracement statistiquement significatives
- Zones dynamiques qui s'adaptent au mouvement des prix
- Points de référence clairs pour l'entrée et la sortie
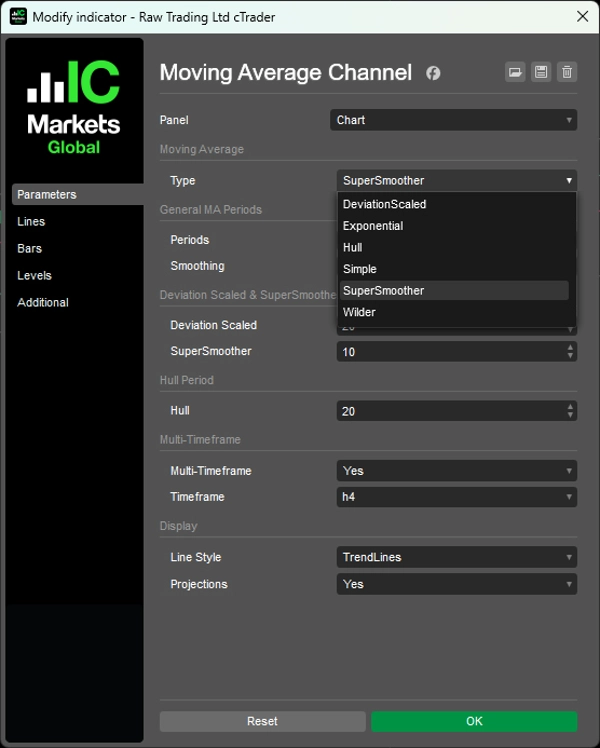
6 types de moyennes mobiles
- Simple, Exponentielle, Wilder, Échelle de déviation, SuperSmoother, Hull
- Double lissage pour SMA/EMA : période + couche de lissage supplémentaire pour des canaux ultra-propres
- Algorithmes avancés : Échelle de déviation s'adapte à la volatilité, SuperSmoother supprime le retard, Hull met l'accent sur l'action récente des prix
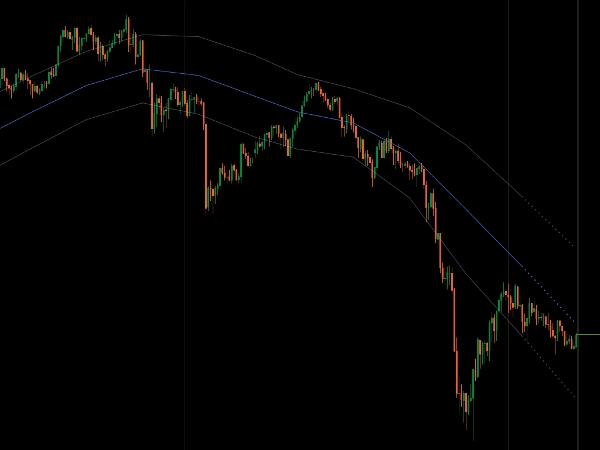
Multi-échelles avec lignes de tendance
- Voir le canal d'une échelle supérieure sur des graphiques d'échelle inférieure
- Deux modes d'affichage : lignes en escalier traditionnelles ou lignes de tendance diagonales (MTF uniquement)
- Les lignes relient les clôtures des barres MTF pour une structure diagonale propre
- Projections intelligentes montrant la direction du canal basée sur le momentum actuel
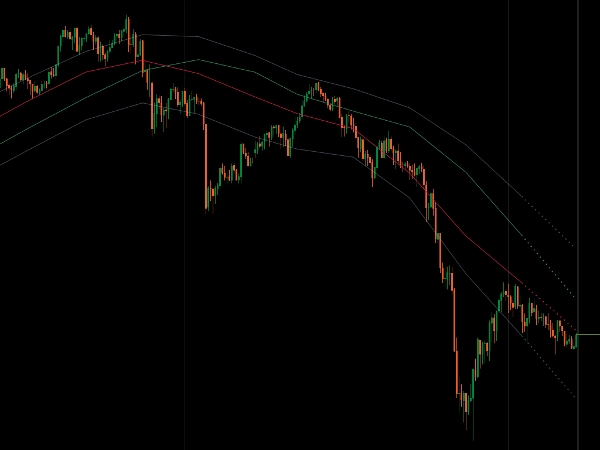
Système visuel épuré
- La pente du canal montre le momentum
- La position du prix montre la force de la tendance
- Les rejets des limites signalent des retournements potentiels
- Un indicateur pour une analyse complète de la structure du marché
__________________________________________________________________________________________
PLUS D'INDICATEURS GRATUITS
Explorez une large gamme d'outils d'analyse de marché — de la structure et du volume à la régression, la volatilité et les échelles de temps personnalisées.
Le code source est disponible sur le dépôt GitHub.
Tous gratuits à utiliser. Mais si vous souhaitez offrir un café en soutien, vous pouvez le faire ici.
Support/Résistance
Volume
- Profileur d'Activité de Volume
- Analyseur d'Efficacité du Volume
- Analyse du Profil de Volume
- Profil de Volume - Mis à jour
- Analyse de la Répartition du Volume
- VWAP (Prix Moyen Pondéré par le Volume)
Moyennes Mobiles
- Canal SSL
- Moyenne Mobile Ancrée
- Moyenne Mobile Échelle de Déviation
- Activateur Haut Bas de Gann
- Ligne de Tendance Instantanée
- MA Adaptative de Kaufman avec Vision de Tendance
- Canal de Moyenne Mobile
- Suite de Moyennes Mobiles
- Moyenne Mobile du Canal de Tendance
Utilitaires/Personnalisé
Basé sur la Régression
Volatilité
Oscillateurs
__________________________________________________________________________________________
AVERTISSEMENT
Le trading comporte des risques. Cet indicateur est destiné uniquement à l'analyse technique — appliquez toujours une gestion des risques appropriée et tradez de manière responsable.
RETROACTION & AMÉLIORATIONS
Si vous avez des suggestions, des demandes de fonctionnalités ou des idées d'amélioration, veuillez laisser un commentaire dans l'onglet Discussion. Vos retours aident à améliorer l'indicateur pour tous.
Résumé
The indicator incorporates built-in Fibonacci reversion zones at 38.2% and 61.8%, which dynamically adjust with price movement to highlight significant pullback areas and provide clear entry and exit reference points. It supports multi-timeframe analysis, allowing higher timeframe channels to be displayed on lower timeframe charts, with two visualization modes: traditional stairstep lines or diagonal trendlines connecting multi-timeframe bar closes. Smart momentum-based projections indicate potential channel direction, while boundary rejection detection signals possible reversals.
This tool offers a cohesive visual system where channel slope reflects momentum and price position indicates trend strength, enabling traders to assess trend direction, momentum shifts, and mean reversion zones across various markets including Forex, Indices, Commodities, Crypto, and Stocks.