Description
APERÇU
Cet indicateur met en œuvre la méthodologie "Identification de tendance par filtrage du prix et du temps" d'Alfred François Tagher, publiée dans le numéro de février 2024 du magazine Technical Analysis of Stocks & Commodities.
Le concept combine l'action des prix avec un filtrage basé sur le temps pour réduire le bruit du marché et identifier les tendances durables. Plutôt que de réagir à chaque mouvement de prix, l'indicateur ne change la direction de la tendance que lorsque le prix clôture au-delà de la plage de la période précédente — une condition qui signale un véritable élan plutôt qu'une fluctuation aléatoire.
RÈGLES DE BASE
Les règles originales sont simples :
- Si la clôture de la période dépasse le plus haut de la période précédente → la tendance est HAUSSIÈRE
- Si la clôture de la période est inférieure au plus bas de la période précédente → la tendance est BAISSIÈRE
- La tendance reste inchangée jusqu'à ce qu'une condition de renversement se produise
Cette approche filtre les mouvements de prix mineurs qui restent dans la plage de la période précédente, se concentrant uniquement sur les cassures qui démontrent un engagement.
FONCTIONNEMENT
L'indicateur compare la clôture de la période actuelle avec le plus haut et le plus bas de la période précédente du timeframe supérieur sélectionné :
- Tendance haussière : Clôture actuelle > plus haut de la période précédente
- Tendance baissière : Clôture actuelle < plus bas de la période précédente
- Pas de changement : La clôture reste dans la plage de la période précédente
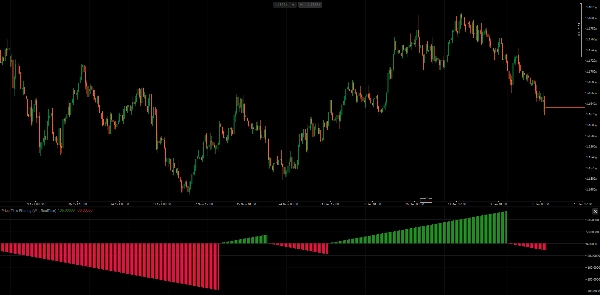
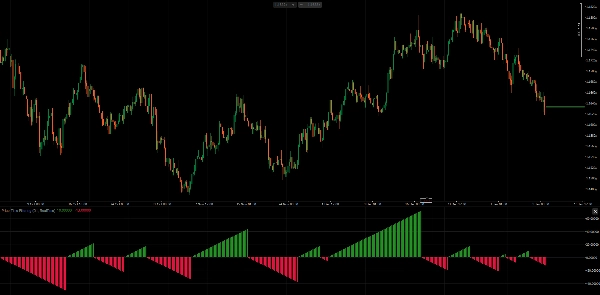
L'histogramme affiche un décompte continu des barres dans la direction de tendance actuelle — valeurs positives pour les tendances haussières, valeurs négatives pour les tendances baissières. Cela visualise à la fois la direction et la durée de la tendance.
MODES DE FILTRAGE
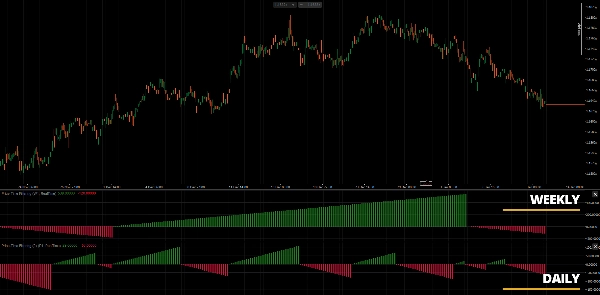
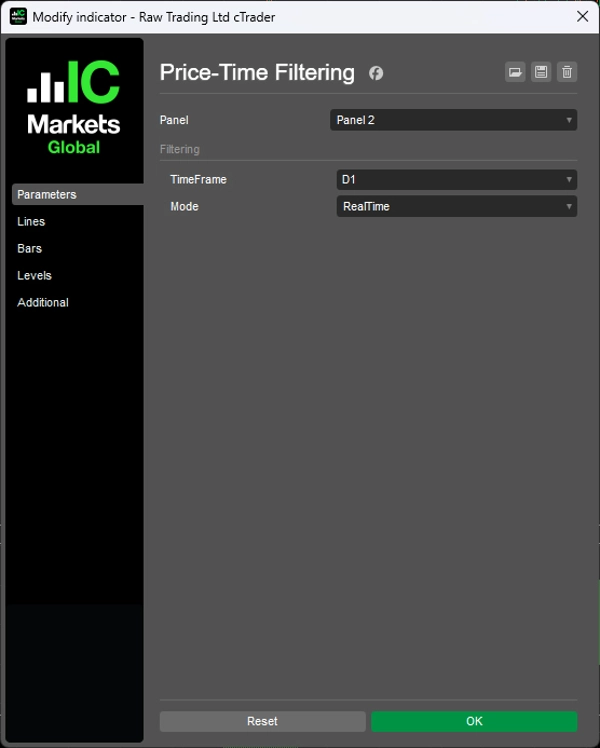
1. Mode PeriodEnd Évalue la tendance uniquement lorsque la période d'un timeframe supérieur est terminée. Cela correspond à la méthodologie originale où la tendance hebdomadaire est déterminée par la clôture du vendredi (ou la clôture de fin de mois pour le mensuel). Plus stable, moins de signaux.
2. Mode RealTime Évalue la tendance à chaque barre en utilisant la clôture actuelle par rapport à la plage de la période précédente. Fournit des signaux plus précoces mais peut générer plus de bruit pendant la période.
PARAMÈTRES
- TimeFrame : Timeframe supérieur pour l'évaluation de la tendance (par exemple, Hebdomadaire, Mensuel)
- Mode : PeriodEnd (méthodologie originale) ou RealTime (variante réactive)
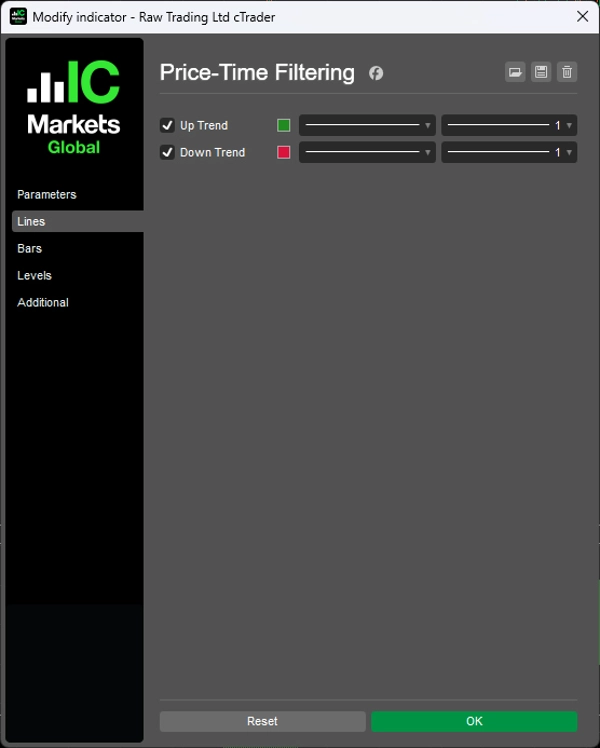
INTERPRÉTATION
- Histogramme vert : Tendance haussière en cours, le nombre de barres indique la durée
- Histogramme rouge : Tendance baissière en cours, le nombre de barres indique la durée
- Réinitialisation de l'histogramme : Renversement de tendance survenu
L'indicateur fonctionne mieux sur des graphiques journaliers avec une sélection de timeframe Hebdomadaire ou Mensuel, comme décrit dans l'article original. Cependant, l'implémentation supporte toute combinaison de timeframes.
REMARQUES
- Conçu à l'origine pour les graphiques journaliers avec évaluation hebdomadaire/mensuelle
- Fonctionne sur toute combinaison de timeframes où le timeframe sélectionné est supérieur au timeframe du graphique
- Le nombre de barres fournit une mesure de la maturité de la tendance — des comptes plus longs suggèrent des tendances établies
- Envisagez de combiner avec une analyse de la structure des prix pour le timing des entrées
RÉFÉRENCE
Tagher, Alfred François. "Trend Identification By Price And Time Filtering." Technical Analysis of Stocks & Commodities, février 2024.
__________________________________________________________________________________________
PLUS D'INDICATEURS GRATUITS
Explorez une large gamme d'outils d'analyse de marché — de la structure et du volume à la régression, la volatilité et les timeframes personnalisés.
Le code source est disponible sur le dépôt GitHub.
Tous gratuits à utiliser. Mais si vous souhaitez offrir un café en soutien, vous pouvez le faire ici.
Support/Résistance
Volume
- Profileur d'Activité de Volume
- Analyseur d'Efficacité du Volume
- Analyse du Profil de Volume
- Profil de Volume - Mis à jour
- Analyse de la Répartition du Volume
- VWAP (Prix Moyen Pondéré par le Volume)
Moyennes Mobiles
- Canal SSL
- Moyenne Mobile Ancrée
- Moyenne Mobile Échelonnée par Écart
- Activateur Haut Bas de Gann
- Ligne de Tendance Instantanée
- MA Adaptative de Kaufman avec Vision de Tendance
- Canal de Moyenne Mobile
- Suite de Moyennes Mobiles
- Moyenne Mobile du Canal de Tendance
Utilitaires/Personnalisés
Basé sur la Régression
Volatilité
Oscillateurs
__________________________________________________________________________________________
AVERTISSEMENT
Le trading comporte des risques. Cet indicateur est destiné uniquement à l'analyse technique — appliquez toujours une gestion des risques appropriée et tradez de manière responsable.
RETROACTION & AMÉLIORATIONS
Si vous avez des suggestions, des demandes de fonctionnalités ou des idées d'amélioration, veuillez laisser un commentaire dans l'onglet Discussion. Vos retours aident à améliorer l'indicateur pour tous.
Résumé
The indicator supports two filtering modes: PeriodEnd mode, which evaluates trends only at the close of a higher timeframe period (e.g., weekly or monthly), providing more stable signals; and RealTime mode, which updates trend status on every bar for more responsive but potentially noisier signals. Users can select the higher timeframe for trend evaluation, typically weekly or monthly, while applying the indicator on lower timeframe charts.
A histogram visually represents trend direction and duration, with positive values and green bars indicating uptrends, negative values and red bars indicating downtrends, and resets marking trend reversals. The indicator is applicable across various markets including Forex, indices, commodities, crypto, and stocks, and supports any timeframe combination where the selected higher timeframe exceeds the chart timeframe.