説明
Pinescriptlabs ストアインジケーター: 🤖Pinescriptlabs ストア cBots:
SmartTrend サポート&レジスタンスライン Gold & BTC ブレイクアウトセッションピボット(新) YieldShield" 🛡️
ICT POWER OF 3 ⚡📊
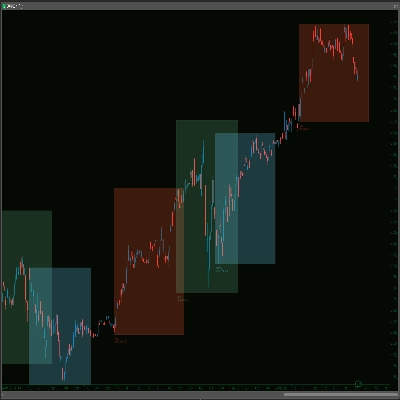
このインジケーターはICTの 「Power of 3」理論を自動化し、チャート上に3つの主要な市場ゾーン—蓄積、操作、分配—を純粋なセッションとその重複を捉える洗練された時間枠で描画します。結果は視覚的な 「マップ」 🗺️で、大口プレイヤーがどこにサポートを設定し、ストップを狩り、トレンドを駆動するかを示します—ローソク足やヒゲの手動分析は不要です!
このアルゴリズムがトレーディングで重要な理由 💡
機関の可視性 👀: 「スマートマネー」が蓄積、操作、分配するゾーンの検出を自動化することで、推測を排除し、実際の 流動性の流れを即座に把握できます。
トラップ&流動性検出 🎯: 操作フェーズ(ヨーロッパ-NYの重複)はストップハントが発生する場所であり、これを見つけることで リスクを低減してトレードに入ることができます。
トレンド確認 🚀: 純粋なNY分配ゾーンは方向性モメンタムの核心を捉え、それに同期して取引することで 成功率を高めます。
一貫性 🔄: 固定時間枠と標準化されたビジュアルを使用することで感情的なバイアスを排除し、 バックテストを簡素化します。
3つのフェーズの検出(重複に注目) 🔍
1️⃣ 蓄積(アジア + 東京/ロンドン重複:午後7時~午前2時 EST)
- 開始 ⏳: 最初の 午後7時 ESTのローソク足で「ボックス」が開き、初期の高値/安値を捉えます。
- 追跡 🔄: 価格がレンジを破る(新高値/新安値)と、ボックスは リアルタイムで拡大します。
- 終了 🚪: 午前2時 ESTでボックスがロックされ、 スマートマネーが 低ボラティリティで注文を吸収した場所を示します。
2️⃣ 操作(ヨーロッパ + ロンドン/NY重複:午前2時~午前9時 EST)
- 開始 ⏳: 最初の 午前2時 ESTのローソク足で検出されます。
- 挙動 🎭: 以前の極値の 偽のブレイクアウトを強調表示し、各拒否を視覚的に追跡します。
- 終了 🚪: 午前9時 ESTで終了し、 ストップハントが集中していた場所を明らかにします。
3️⃣ 分配(純粋なNYセッション:午前9時~午後2時 EST)
- 開始 ⏳: 午前9時 ESTのローソク足で開始します。
- 進展 📈: ボックスは 最も強いトレンドと共に成長し、機関が ポジションを解放します。
- 終了 🚪: 午後2時 ESTで終了し、 最高のモメンタム&ボリュームフェーズを示します。
日次管理&自動クリーンアップ 🧹
チャートの乱雑さを避けるために、インジケーターは 直近N日分のみ(設定可能)を保持します。超過すると、古いゾーン—境界線、塗りつぶし、ラベル—を 自動的に削除し、分析を 最新のデータに集中してクリーンに保ちます。
概要
The indicator identifies:
1. Accumulation phase (7 PM – 2 AM EST, Asia + Tokyo/London overlap), marking where smart money absorbs orders with low volatility.
2. Manipulation phase (2 AM – 9 AM EST, Europe + London/New York overlap), highlighting false breakouts and stop hunts.
3. Distribution phase (9 AM – 2 PM EST, pure New York session), showing where institutions release positions during the highest momentum and volume.
ICT Power of 3 enhances trading by providing institutional visibility, trap and liquidity detection, and trend confirmation. It uses fixed timeframes and standardized visuals to reduce emotional bias and simplify backtesting. The indicator also manages chart clutter by automatically deleting old zones beyond a configurable number of days, keeping the analysis focused on recent data. It supports markets including commodities, cryptocurrencies (BTC, ETH), and symbols like BTCUSD and XAUUSD.
カスタマーレビュー
5 | 100 % | |
4 | 0 % | |
3 | 0 % | |
2 | 0 % | |
1 | 0 % |