Descrizione
Pannello di controllo del grafico per una navigazione più veloce — zoom, intervallo temporale e configurazione del grafico senza lasciare il grafico.
Preimpostazioni di zoom, inserimento manuale dello zoom, selettore completo di intervalli temporali e grafici, intervalli temporali preferiti configurabili, separatori di periodo, griglia con numeri arrotondati e linee bid/ask in tempo reale — tutto accessibile tramite pulsanti UI sul grafico. Progettato per ridurre il tempo speso a navigare nei menu nativi di cTrader durante le sessioni di trading attive.
CARATTERISTICHE
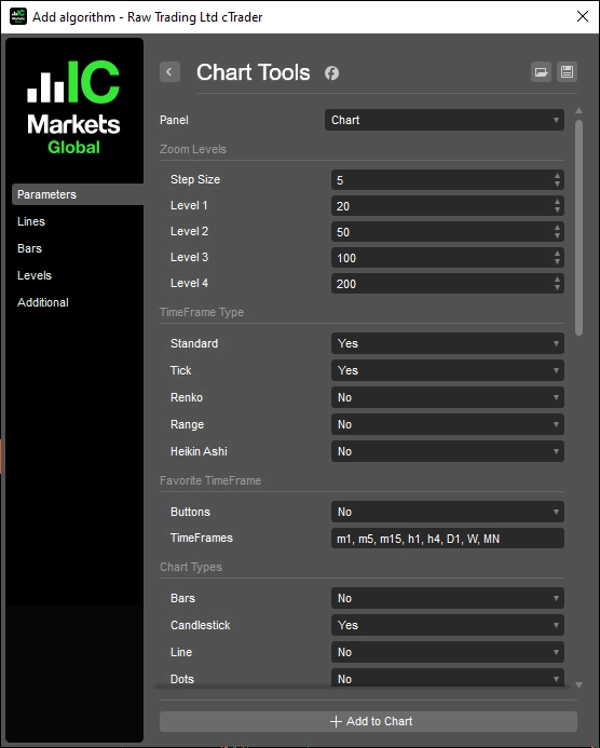
Controlli di Zoom
- Zoom in / zoom out con dimensione del passo configurabile
- Quattro livelli di zoom preimpostati configurabili per accesso con un clic
- Inserimento manuale dello zoom con pulsante di applicazione
- Sincronizzato con gli eventi di zoom nativi di cTrader
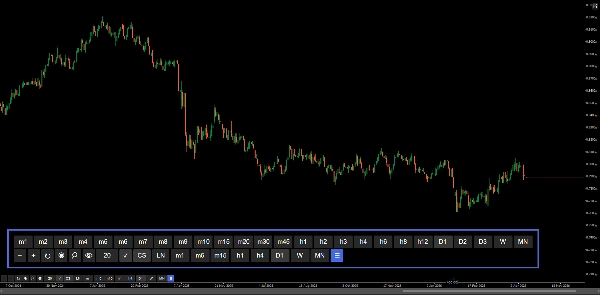
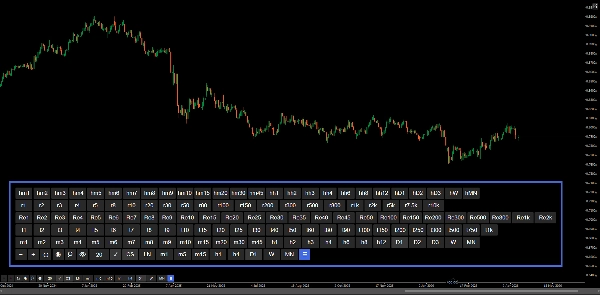
Selettore di Intervallo Temporale
- Pannello completo di pulsanti che copre tutti i tipi di intervallo temporale: Standard, Heikin Ashi, Renko, Range, Tick
- Modalità "Tutti" che mostra ogni tipo come righe separate
- Intervallo temporale attivo evidenziato automaticamente
- Attiva/disattiva la visibilità del pannello con il pulsante ☰
Intervalli Temporali Preferiti
- Riga di accesso rapido configurabile tramite input separato da virgole (es. m1, h1, D1)
- Supporta tutti i tipi di intervallo temporale inclusi Range e Tick
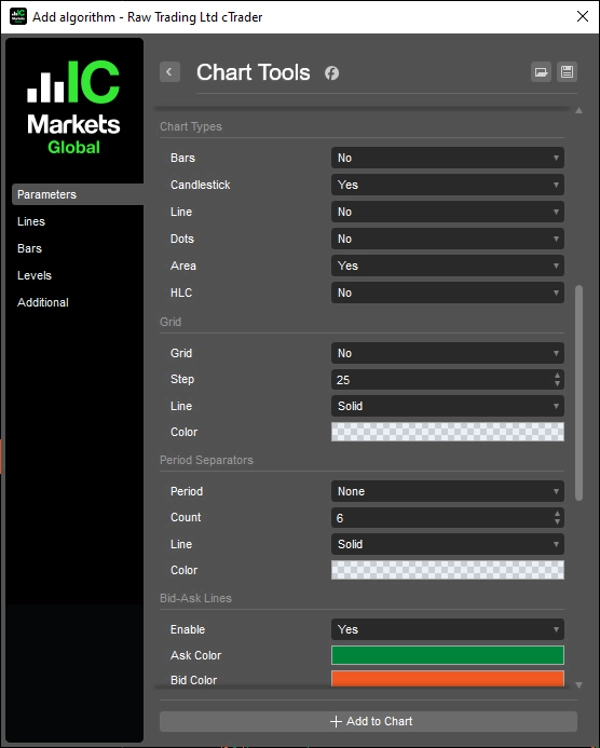
Tipo di Grafico
- Pulsanti di commutazione rapida per: Barre, Candlestick, Linea, Punti, Area, HLC
- Tipo di grafico attivo evidenziato automaticamente
- Ogni pulsante configurabile individualmente tramite parametri
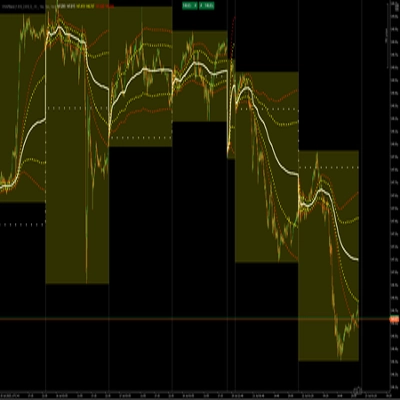
Griglia
- Griglia basata su numeri arrotondati con intervallo pip configurabile (Moltiplicatore)
- Etichette dei prezzi con formattazione decimale intelligente
- Le linee si estendono per 10 barre oltre l'ultima barra
- Attiva/disattiva toggle
Separatori di Periodo
- Separatori giornalieri, settimanali, mensili e annuali
- Conteggio, colore, stile della linea e spessore configurabili
- Aggiornamento automatico durante lo scorrimento e lo zoom
Linee Bid/Ask
- Linee bid e ask in tempo reale che si estendono all'infinito
- Colori configurabili per ask e bid
- Attiva/disattiva toggle
Pulsanti
- Posizione: Alto a destra, Alto a sinistra, Basso a destra, Basso a sinistra
- Margine configurabile
- Colori dei pulsanti e colori del testo configurabili — incluso stato attivo, applica zoom e pulsante di commutazione del grafico
__________________________________________________________________________________________
ALTRI INDICATORI GRATUITI
Esplora un'ampia gamma di strumenti di analisi di mercato — dalla struttura e volume alla regressione, volatilità e intervalli temporali personalizzati.
Il codice sorgente è disponibile nel repository GitHub.
Tutti gratuiti da usare. Ma se vuoi offrire un supporto "caffè", puoi farlo qui.
Supporto/Resistenza
Volume
- Volume Activity Profiler
- Volume Efficiency Analyzer
- Volume Profile Analytics
- Volume Profile - Aggiornato
- Volume Spread Analysis
- VWAP (Prezzo Medio Ponderato per il Volume)
Medie Mobili
- SSL Channel
- Media Mobile Ancorata
- Media Mobile Scalata per Deviazione
- Gann High Low Activator
- Linea di Tendenza Istantanea
- Media Mobile Adattiva di Kaufman con Trend Vision
- Canale Media Mobile
- Suite di Medie Mobili
- Media Mobile Canale di Tendenza
Utilità/Personalizzati
- Strumenti per Grafici
- Intervalli Temporali Personalizzati
- Candlestick di Intervallo Temporale Superiore
Basato su Regressione
Volatilità
Oscillatori
__________________________________________________________________________________________
DICHIARAZIONE DI NON RESPONSABILITÀ
Il trading comporta rischi. Questo indicatore è destinato solo all'analisi tecnica — applica sempre una corretta gestione del rischio e fai trading responsabilmente.
FEEDBACK E MIGLIORAMENTI
Se hai suggerimenti, richieste di funzionalità o idee per miglioramenti, lascia un commento nella scheda Discussione. Il tuo feedback aiuta a migliorare l'indicatore per tutti.
Riepilogo
Users can configure a quick-access row of favorite timeframes supporting all timeframe types. The chart type switcher offers quick buttons for Bars, Candlestick, Line, Dots, Area, and HLC charts, each with individual configuration and automatic active state highlighting.
Additional features include a round numbers-based grid with configurable pip intervals and smart decimal formatting, daily to yearly period separators with customizable appearance, and live bid/ask lines extending indefinitely with color customization and toggle options.
The control panel’s buttons can be positioned in any corner of the chart with configurable margins and colors, including active states and zoom application. This tool aims to streamline active trading sessions by reducing time spent navigating native menus, supporting efficient technical analysis on various chart types and timeframes.
Recensioni dei clienti
5 | 100 % | |
4 | 0 % | |
3 | 0 % | |
2 | 0 % | |
1 | 0 % |