
S&R Structural ZigZag
インジケーター
602 ダウンロード数
バージョン 1.0、Jun 2025
Windows、Mac
5.0
レビュー: 1
説明
Pinescriptlabs ストアのインジケーター: 🤖Pinescriptlabs ストア cBots : (cBot)
PRICE ACTION (New)
Gold & BTC ブレイクアウトセッションピボット(new)
トレーリングスマートアルゴリズム(New)
ダイナミック
マーケットストラクチャー
分析
の
ターニングポイント
ジグザグサポート&レジスタンスとスイング
1. このインジケーターは何をするのか? ❓
🔍 価格のスイング(高値&安値)を検出
- 最近のバーをスキャン(「分析深度」)して、その範囲内の最高/最低価格を見つけます。
- スイングを%閾値(例:前回のスイングに対して1%以上の変化)で検証 → 新しい✅スイング高値/安値をマークします。
- ノイズを削減⚡:分析期間の半分が高値更新/安値更新なしで経過した場合のみスイングを確認します。
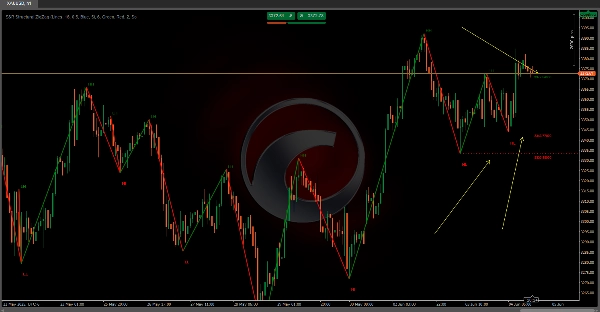
📉 ジグザグトレンドラインを描画
- スイングを動的な線で接続:
-
- 🟢 緑 = 上昇トレンド(新しいスイング > 前のスイング)。
- 🔴 赤 = 下降トレンド(新しいスイング < 前のスイング)。
⏹️ 重要なレベルを強調表示
- サポート/レジスタンスライン:各スイングの正確な価格に描画し、右方向に延長
- ラベルは価格値を表示 📌 (例:「1.1050」)して即時分析を可能にします。
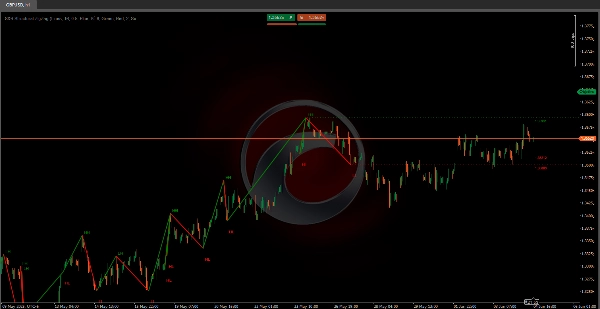
🚦 マーケット構造を明らかにする
- 一目でトレンドを識別:
-
- 強気 = 高値更新(HH)+安値切り上げ(HL)。
- 弱気 = 高値切り下げ(LH)+安値更新(LL)。
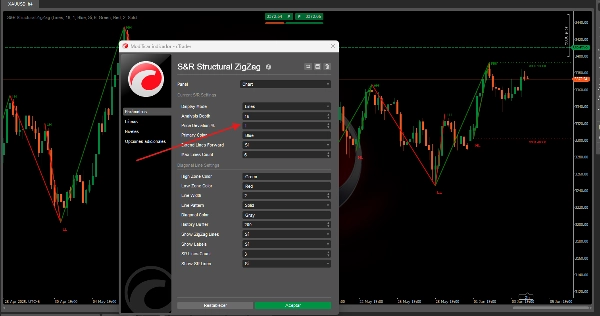
2. 使い方(セットアップガイド) ⚙️
cTrader にインストール:チャートにドラッグ&ドロップ!
主な設定:
- 分析深度 🔎:
10(デフォルト) → 値が大きいほどノイズをフィルターし、小さいほど多くのスイングを捉えます。 - 価格偏差% 📏:
1.0%(調整可能) → スイングを検証するための最小価格変動。 - スイングラベル 🏷️ (HH/HL/LH/LL):オン/オフ切替。
- ラインの延長 ➡️:S/R レベルを無限に投影するか、現在のバーまでに制限。
概要
インジケーターのプロフィール
カスタマーレビュー
5.0
レビュー: 1
5 | 100 % | |
4 | 0 % | |
3 | 0 % | |
2 | 0 % | |
1 | 0 % |
カスタマーレビュー
August 18, 2025
Clear structural support/resistance mapping, customizable, lightweight. Cons: No auto-labels, no historical level tracking, no alerts.
ディスカッション
よくあるご質問
BTCUSD
Breakout
Supertrend
Commodities
RSI
Crypto
XAUUSD
cTrader Storeで入手可能な取引ボット、インジケーター、プラグインなどの商品は、第三者の開発者が提供するものであり、情報と技術の取得のみを目的としてご利用いただけます。cTrader Storeはブローカーではなく、投資助言や個人的な推奨を行うことも、将来のパフォーマンスを保証することもありません。


価格
登録日 03/10/2024
163
販売
37.72K
無料インストール