説明
Pinescriptlabs ストアのインジケーター: Pinescriptlabs ストア cBots : (cBot) Gold & BTC BreakoutSession Pivots(新着)
PRICE ACTION (新着)
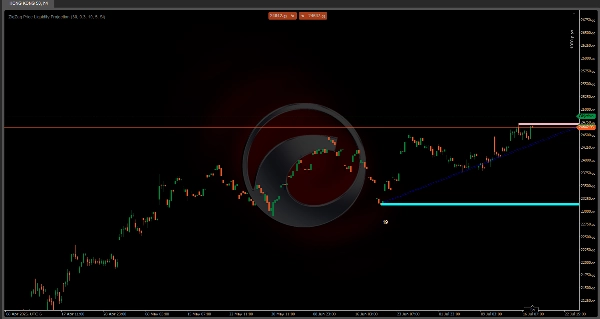
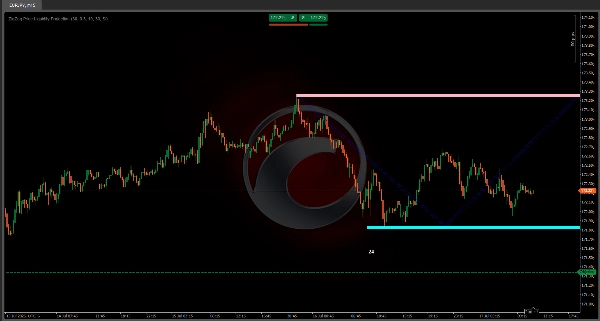
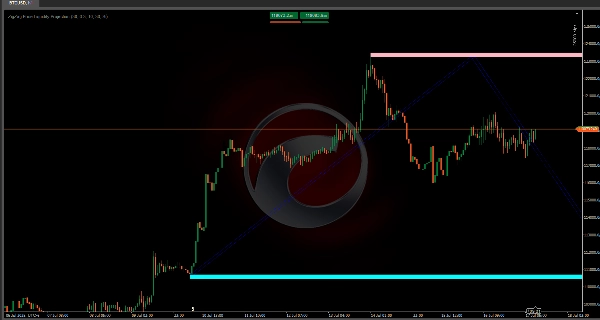
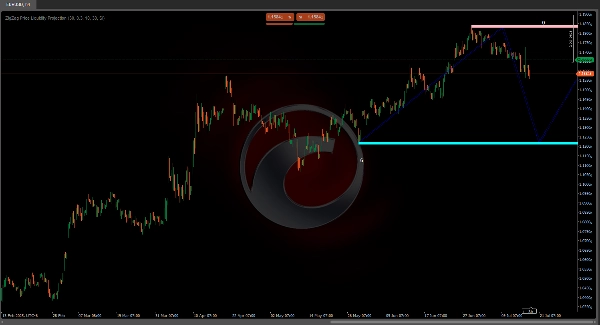
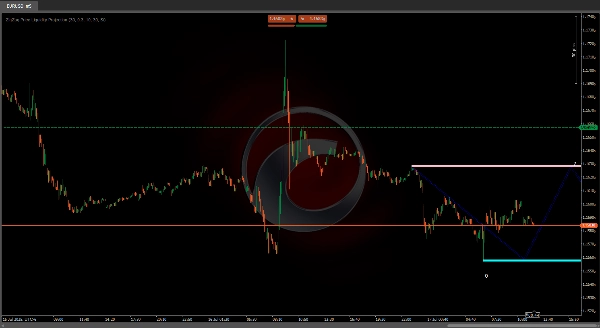
📊 ZigZag 価格流動性予測インジケーター
「市場がどこで反転するかを事前に見る!」 🔮
このインジケーターは 重要なサポート/レジスタンスレベル 🛑 を特定し、 流動性ゾーン 💧 をチャート上で予測します。使用しているのは:
- 🔍 ピボットポイント: 重要な高値と安値を検出
- 📈 ATR ボラティリティ: 精密な調整のための価格変動を測定
- 💦 流動性予測: ジグザグパターンを通じて高活動エリア(買い/売りクラスター)を予測
🎯 目的: エントリー/エグジットの判断を改善するために価格反応ゾーン(反発/ブレイクアウト/統合)を予測
✨ ジグザグの利点
これらの接続されたラインは 宝の地図 🗺️ のように機能し、以下を示します:
1️⃣ 定義された範囲内の将来の価格経路
2️⃣ 価格が停滞または反転する可能性のあるゾーン
3️⃣ トレード計画のための視覚的参照点
🚦 主な特徴:
- 📅 重要レベルの早期警告システム
- 🎯 ピボット構造(強気/弱気の経路)に基づく将来の動きを予測
- 🔢 タッチカウンター (例:「24」= そのレベルでの過去のテスト回数24回)
⚙️ 推奨設定
設定値効果
ATR 期間
30
🎚️ ボラティリティ感度
ピボット期間
30
🔍 ピボットの重要度範囲
⏳ 最適なタイムフレーム: 15分 - 4時間チャート ⏱️
💡 プロのヒント:
「ローソク足パターン🕯️と組み合わせて確認を!ジグザグは価格がどこに行くかを示し、ローソク足はいつそれが起こるかを示します。」
🎯 最終的なまとめ:
強力な オールインワンの視覚ツール で以下を見つけるのに役立ちます:
✅ 流動性ゾーン 💦
✅ 重要レベル 🎯
✅ 将来の価格経路 🚀
動きを追いかけるのではなく、予測したいデイトレーダーに最適!動きを予測するためのツールです! 🏃💨