
설명
🚀 10,000명 이상의 트레이더가 이미 우리의 TOP 지표🏆
전문가들이 왜 우리를 선택하는지 알아보세요 – 가장 강력한 도구들이 cTrader(지표, 알고리즘, cBots)에서 여러분을 기다리고 있습니다.
👉 모든 TOP 시스템을 여기에서 받으세요:
_______________________________________________
📌 시장 구조 지표
· ✅ AdvancedMarket Structure: Bos, Choch, SwinLevels, Order Blocks, 시장 구조& 유동성 탐색기
· 🔄 동적 시장 구조 전환점 분석
· 🧱 오더 블록
· ⚖️ 시장 불균형
· ⛓️ BOS & CHOCH
· 🧠 ICT 파워 오브 3
· 🌀 시장 극성 구역
_______________________________________________
🔚 스마트 종료 시스템
· 📍 트레일링 스마트 알고리즘
_______________________________________________
📐 지그재그 지표
· 🔍 지그재그 가격 유동성 투영
· 🧭 S&R 구조적 지그재그
· ➖ 지그재그
· 🎯 지그재그 극한 추적기
_______________________________________________
🧱 지지 및 저항 지표
· 🟩 스마트트렌드 지지 및 저항선
· 🧱 모든 지지 및 저항 레벨
_______________________________________________
📊 추세 및 채널 지표
· 🔄 자동 추세 채널
· 📊 슈퍼트렌드
· ⚡모멘텀 추세 분석기
· 🧠 적응형 추세 채널
· 💥 채널 돌파 시스템
· 🌈 동적 추세 그라디언트
· ⭐ 프리미엄 SSL 채널
· 🔁 반응형 이동 평균
_______________________________________________
💧 거래량 및 유동성 도구
· 🔥 거래량 POC 히트맵
· 📉 레버리지 청산 지도
· 🔍 모멘텀 공정 가치 갭
· 🕒 공정 가치 갭 세션
_______________________________________________
⚡ 모멘텀 및 RSI 지표
· 📈 RSI 추세 트리거
· 🚀 동적 범위 모멘텀
_______________________________________________
🔮 예측 및 투영 도구
· 📈 거래량 기반 시장 흐름 투영기
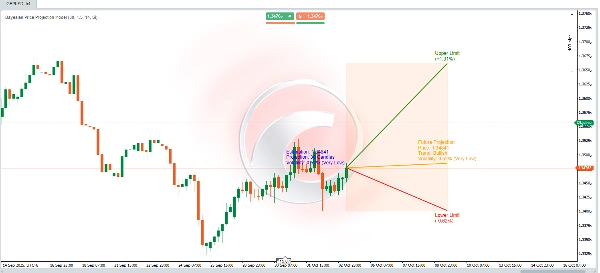
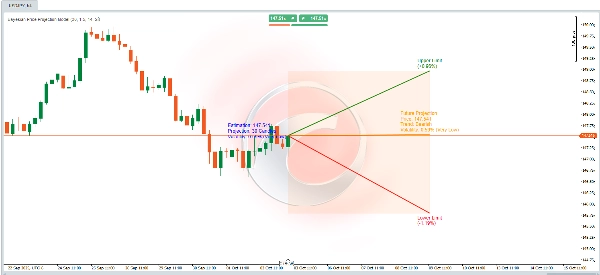
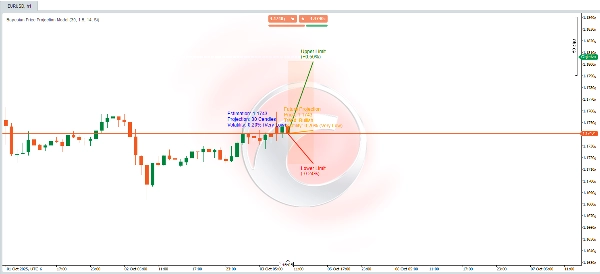
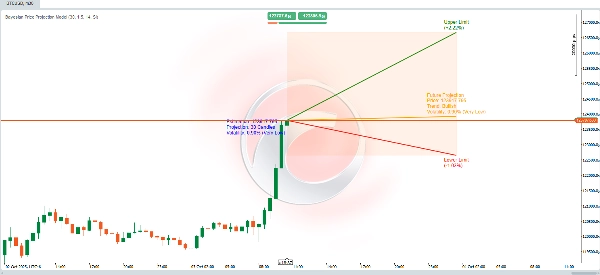
📊 동적 가격 투영 알고리즘 📈
이 알고리즘은 **통계 계산**, **기술 분석**, 그리고 **베이지안 이론**을 결합하여 미래 가격을 예측하며, 상한과 하한을 나타내는 **불확실성 범위**를 제공합니다. 계산은 시장의 **추세**, **변동성**, 그리고 새로운 최고점 또는 최저점에 도달할 역사적 확률을 고려하여 투영을 조정하도록 설계되었습니다.
작동 방식은 다음과 같습니다:
🚀 미래 가격 투영
동적 계산은 세 가지 주요 요소를 기반으로 미래 가격을 추정합니다:
1. **추세**: 시장이 상승 또는 하락할 경향이 있는지 정의합니다.
2. **변동성**: 과거 변동을 기반으로 예상 변화의 크기를 정량화합니다.
🧠 **베이지안 확률 조정**
- 조건부 확률은 **베이즈 공식**을 사용하여 계산됩니다:
\[
P(A|B) = \frac{P(B|A) \cdot P(A)}{P(B)}
\]
이는 조건부 정보를 사용하여 미래 사건을 모델링합니다:
- 가격이 상승 추세일 때 새로운 사상 최고점에 도달할 확률.
- 가격이 하락 추세일 때 새로운 사상 최저점에 도달할 확률.
- 이러한 확률은 다음을 고려하여 미래 가격 추정을 정제합니다:
- **높은 변동성**은 극단적 수준(최고/최저)에 도달할 가능성을 증가시킵니다.
- **시장 추세**는 예상 가격 움직임 방향에 영향을 미칩니다.
🌟 **변동성 계산**
- 변동성은 14기간 창을 가진 **ATR(평균 진폭 범위)** 지표를 사용하여 측정됩니다. 이는 가격 변동의 평균 진폭을 반영합니다.
- 변동성을 백분율로 표현하기 위해 ATR을 종가로 나눈 후 200을 곱하여 정규화합니다.
- 변동성은 더 나은 해석을 위해 설명적 수준(예: **매우 낮음**, **낮음**, **보통** 등)으로 분류됩니다.
---
🎯 **편차 한계(상한 및 하한)**
- 상한과 하한은 추정된 미래 가격 주위의 **예상 범위**를 형성하여 불확실성의 틀을 제공합니다.
- 이 한계는 다음을 사용하여 ATR을 조정하여 계산됩니다:
- 사용자 정의 **배수**(`factor_desviacion`).
- 앞서 계산된 **베이지안 확률**.
- 불확실성이 시간이 지남에 따라 증가한다는 원리를 포함하는 **예상 기간의 제곱근**(`proyeccion_dias`).
🔍 **모델 해석**
이는 다음을 결합한 **동적 확률 모델**로 볼 수 있습니다:
- **기술 분석**(추세 및 ATR).
- **베이지안 이론**을 사용한 확률 정제.
- 잠재적 미래 가격 움직임과 관련 불확실성을 이해하는 데 도움이 되는 **시각적 투영 범위** 제공.
⚡ 변동성이 큰 시장을 분석하든, 강세/약세 시나리오를 확인하든, 이 도구는 강력하고 데이터 기반의 접근 방식을 제공합니다! 🚀


