
Opis
DOSTĘPNA ROZSZERZONA WERSJA — TUTAJ
Obecnie przeglądasz oryginalną wersję. Rozszerzona wersja tego wskaźnika została wydana z dodatkowymi funkcjami:
- Ulepszony wyświetlacz wieku: format lat, miesięcy, tygodni, dni (np. „3l 2t 4d”)
- Pokaż wszystkie FVG: Ustaw „FVG do wyświetlenia” na -1, aby wyświetlić nieograniczoną liczbę historycznych FVG
- Rozszerz wypełnione FVG: Opcja rozszerzenia wypełnionych pól FVG do bieżącego słupka
- Poziomy Fibonacciego: Automatyczne poziomy (23,6%, 38,2%, 50%, 61,8%, 78,6%) na częściowych i wypełnionych FVG
- Próg częściowego wypełnienia: Konfigurowalny próg (50-99%, domyślnie 90%)
__________________________________________________________________________________________
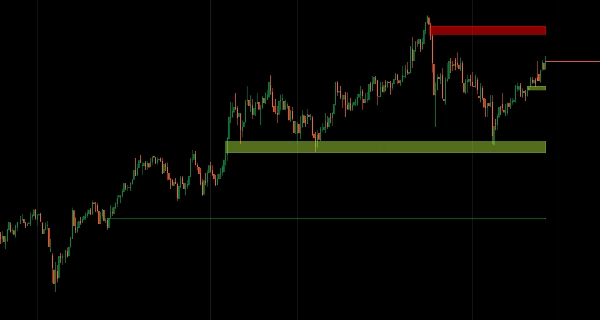
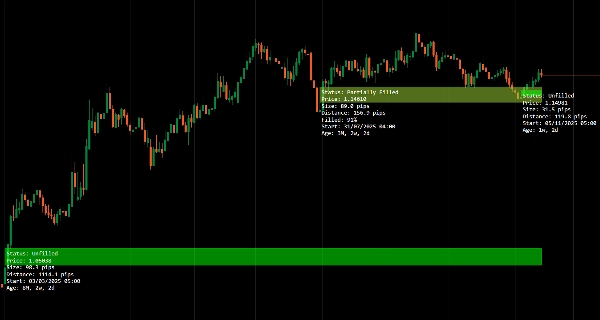
Identyfikuj luki wartości godziwej z monitorowaniem wieku i statusu wypełnienia.
Automatycznie wykrywa bycze i niedźwiedzie luki, śledzi ich zachowanie wypełnienia (niewypełnione, częściowo wypełnione, całkowicie wypełnione) w czasie rzeczywistym oraz wyświetla wiek luki dla priorytetyzacji.
Skanowanie wieloczasowe w celu dopasowania strukturalnych luk HTF do akcji cenowej LTF, dynamiczne aktualizacje statusu podczas interakcji ceny ze strefami oraz minimalne, nieinwazyjne oznaczenia zapewniają skoncentrowaną analizę nierównowagi płynności dla traderów celujących w wypełnienia luk i wejścia oparte na strukturze.
CECHY
Identyfikacja FVG
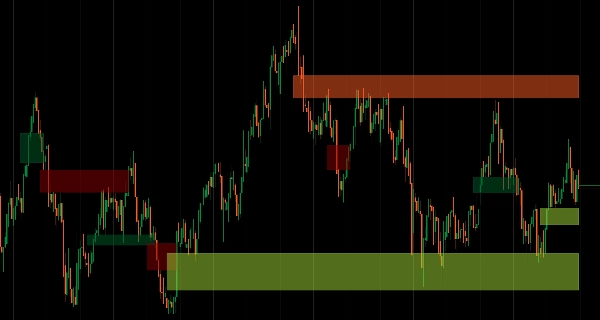
- Automatycznie wykrywa bycze i niedźwiedzie luki wartości godziwej
- Śledzi status niewypełniony, częściowo wypełniony i całkowicie wypełniony w czasie rzeczywistym
- Czyste wizualne wykreślanie z minimalnym zagraceniem wykresu
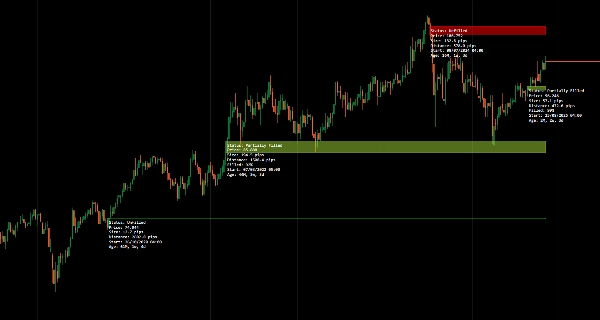
Oznaczanie wieku
- Wyświetla, ile czasu minęło od powstania każdej luki
- Pomaga priorytetyzować świeże vs. przestarzałe luki do wyboru transakcji
- Kontekst czasowy poprawia podejmowanie decyzji o istotności luki
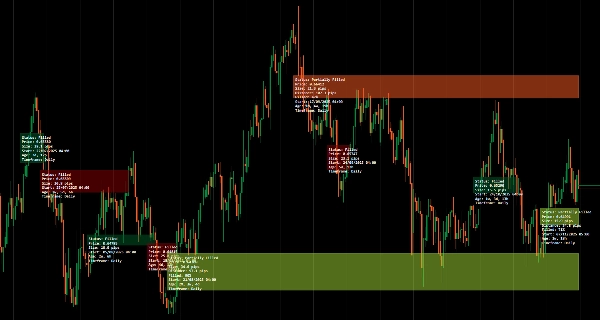
Śledzenie statusu
- Pokazuje aktualny status wypełnienia: niewypełniony, częściowo wypełniony lub całkowicie wypełniony
- Aktualizuje się dynamicznie w miarę interakcji ceny z luką
- Wizualne potwierdzenie przechwycenia płynności
Tryb wieloczasowy
- Skanuj i wyświetlaj FVG z wyższych interwałów czasowych na wykresach z niższych interwałów
- Dopasuj strukturalne luki HTF do akcji cenowej LTF
- Usprawnia analizę wieloczasową
Czysty, minimalistyczny interfejs
- Nieinwazyjne etykiety zaprojektowane dla przejrzystości
- Informacyjne bez zagracania widoku cenowego
- Profesjonalna prezentacja dla skoncentrowanej analizy
__________________________________________________________________________________________
WIĘCEJ DARMOWYCH WSKAŹNIKÓW
Odkryj szeroki zakres narzędzi analizy rynku — od struktury i wolumenu po regresję, zmienność i niestandardowe interwały czasowe.
Kod źródłowy jest dostępny w repozytorium GitHub repository.
Wszystko darmowe do użytku. Ale jeśli chcesz wesprzeć kawą, możesz to zrobić tutaj.
Wsparcie/Oporność
Wolumen
- Profiler aktywności wolumenu
- Analizator efektywności wolumenu
- Analiza profilu wolumenu
- Profil wolumenu - aktualizacja
- Analiza rozkładu wolumenu
- VWAP (Wolumenowo ważona średnia cena)
Średnie kroczące
- Zakotwiczona średnia krocząca
- Średnia krocząca skalowana odchyleniem
- Natychmiastowa linia trendu
- Adaptacyjna średnia Kaufmana z wizją trendu
- Kanał średniej kroczącej
- Pakiet średnich kroczących
- Średnia krocząca kanału trendu
Narzędzia/niestandardowe
Oparte na regresji
Zmienność
Oscylatory
__________________________________________________________________________________________
ZASTRZEŻENIE
Trading wiąże się z ryzykiem. Ten wskaźnik jest przeznaczony wyłącznie do analizy technicznej — zawsze stosuj odpowiednie zarządzanie ryzykiem i handluj odpowiedzialnie.
OPINIE I ULEPSZENIA
Jeśli masz sugestie, prośby o funkcje lub pomysły na ulepszenia, prosimy o pozostawienie komentarza na karcie Dyskusja. Twoja opinia pomaga ulepszać wskaźnik dla wszystkich.
Podsumowanie
Opinie klientów
5 | 100 % | |
4 | 0 % | |
3 | 0 % | |
2 | 0 % | |
1 | 0 % |


![Logo „[Hamster-Coder] Pivot Points (Demo)”](https://cdn.ctrader.com/image/webp/87b54299-8c73-4942-9207-4bc6db824811_31153)

