
Opis
PRZEGLĄD
Wskaźnik Waddah Attar Explosion (WAE) został stworzony przez Ahmada Waddaha Attara i wprowadzony do społeczności handlowej w 2007 roku. Łączy pomiar momentum MACD z analizą zmienności Bollinger Bands, aby identyfikować momenty „eksplozji cenowej” — okresy, gdy cena przechodzi z konsolidacji do silnego ruchu kierunkowego.
Wskaźnik odpowiada na dwa pytania:
- Czy momentum rośnie? (mierzone przez tempo zmiany MACD)
- Czy zmienność się zwiększa? (mierzone przez szerokość Bollinger Bands)
Gdy oba warunki spełniają się powyżej filtra szumu (Strefa Martwa), sygnalizuje to potencjalny wybuchowy ruch.
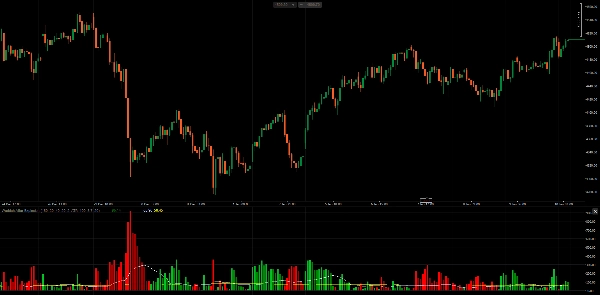
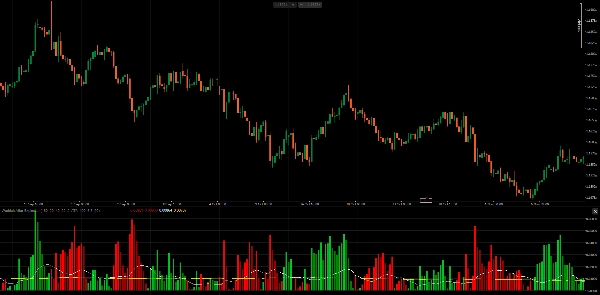
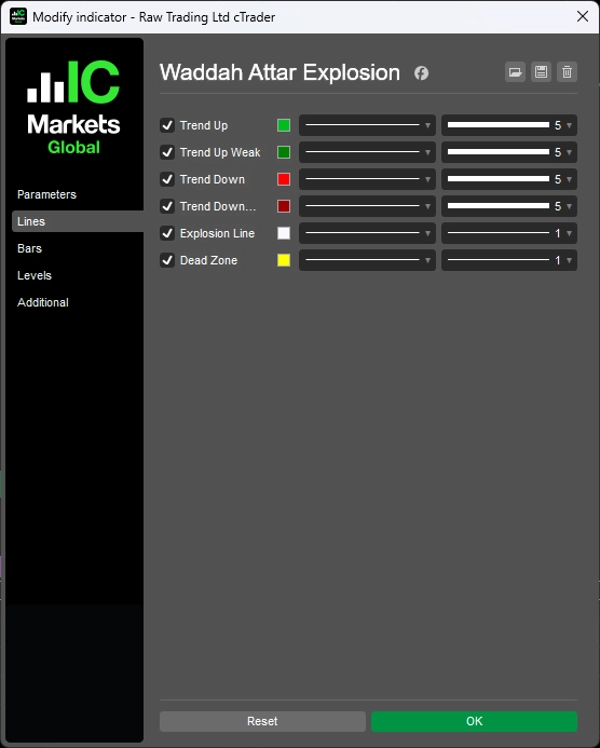
SKŁADNIKI
1. Histogram Trendu (Zielony/Czerwony) Pokazuje tempo zmiany linii MACD, pomnożone przez współczynnik czułości.
- Obliczenia:
(MACD_current - MACD_previous) × Sensitivity - Zielone słupki: Momentum wzrostowe (przyspieszanie MACD w górę)
- Czerwone słupki: Momentum spadkowe (przyspieszanie MACD w dół)
- Jasny kolor: Momentum rośnie w porównaniu do poprzedniego słupka
- Ciemny kolor: Momentum maleje w porównaniu do poprzedniego słupka
2. Linia Eksplozji (Biała) Reprezentuje szerokość Bollinger Bands, wskazując na rozszerzanie lub kurczenie się zmienności.
- Obliczenia:
BB_Upper - BB_Lower - Rosnąca: Zmienność się zwiększa (potencjalny wybicie)
- Malejąca: Zmienność się kurczy (konsolidacja)
3. Strefa Martwa (Żółta) Próg filtrujący, eliminujący słabe sygnały spowodowane szumem rynkowym.
- Na bazie ATR: Dostosowuje się do aktualnej zmienności rynku
- Stałe Pipsy: Statyczna wartość progu
JAK AHMAD WADDAH ATTAR GO UŻYWA
Według oryginalnego autora:
Zasady wejścia na kupno Wszystkie warunki muszą być spełnione:
- Zielony histogram rośnie
- Zielony histogram jest powyżej Linii Eksplozji
- Linia Eksplozji rośnie
- Zarówno zielony histogram, jak i Linia Eksplozji są powyżej Strefy Martwej
Zasady wejścia na sprzedaż Wszystkie warunki muszą być spełnione:
- Czerwony histogram rośnie
- Czerwony histogram jest powyżej Linii Eksplozji
- Linia Eksplozji rośnie
- Zarówno czerwony histogram, jak i Linia Eksplozji są powyżej Strefy Martwej
Zasady wyjścia
- Wyjście z pozycji długiej, gdy zielony histogram przecina Linia Eksplozji od góry w dół
- Wyjście z pozycji krótkiej, gdy czerwony histogram przecina Linia Eksplozji od góry w dół
Kluczowa wskazówka Kąt Linii Eksplozji ma znaczenie. Gdy Linia Eksplozji jest skierowana w górę, a histogram przebija ją od dołu, potwierdza to, że zmienność aktywnie rośnie — „eksplozja” jest prawdziwa, a nie fałszywym sygnałem.
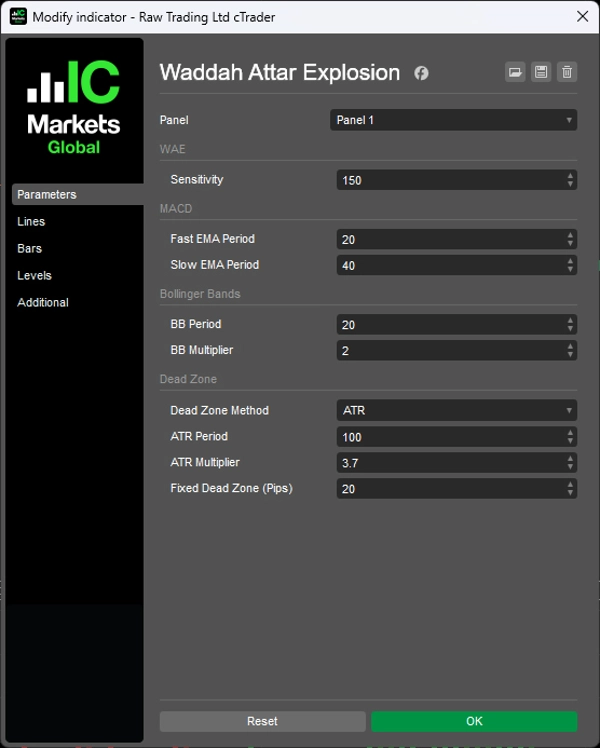
PARAMETRY
1. Czułość
- Czułość (150): Mnożnik tempa zmiany MACD
2. MACD
- Okres szybkiej EMA (20): Szybka średnia krocząca do obliczeń MACD
- Okres wolnej EMA (40): Wolna średnia krocząca do obliczeń MACD
3. Bollinger Bands
- Okres BB (20): Okres cofania Bollinger Bands
- Mnożnik BB (2.0): Mnożnik odchylenia standardowego
4. Strefa Martwa
- Metoda Strefy Martwej (ATR): Wybór między bazą ATR a stałymi pipsami
- Okres ATR (100): Okres do obliczeń ATR
- Mnożnik ATR (3.7): Mnożnik stosowany do ATR dla Strefy Martwej
- Stała Strefa Martwa (20): Wartość Strefy Martwej w pipsach (przy użyciu metody stałej)
UWAGI
- Wskaźnik działa na wszystkich interwałach czasowych. Oryginalny autor zalecał H1 i M30.
- Strefa Martwa oparta na ATR jest zalecana, ponieważ dostosowuje się do różnych instrumentów i warunków rynkowych.
- Parametr Czułości może wymagać dostosowania w zależności od interwału czasowego i zmienności instrumentu.
- Ten wskaźnik identyfikuje zgodność momentum i zmienności — samodzielnie nie przewiduje kierunku. Rozważ użycie go wraz z analizą trendu lub poziomami wsparcia/oporu.
__________________________________________________________________________________________
WIĘCEJ DARMOWYCH WSKAŹNIKÓW
Odkryj szeroki zakres narzędzi analizy rynku — od struktury i wolumenu po regresję, zmienność i niestandardowe interwały czasowe.
Kod źródłowy jest dostępny na GitHub repozytorium.
Wszystko darmowe do użytku. Ale jeśli chcesz wesprzeć kawą, możesz to zrobić tutaj.
Wsparcie/Oporność
Wolumen
- Profiler Aktywności Wolumenu
- Analizator Efektywności Wolumenu
- Analiza Profilu Wolumenu
- Profil Wolumenu - Aktualizacja
- Analiza Rozpiętości Wolumenu
- VWAP (Wolumenowo ważona średnia cena)
Średnie kroczące
- Kanał SSL
- Zakotwiczona średnia krocząca
- Średnia krocząca skalowana odchyleniem
- Aktywator Ganna High Low
- Natychmiastowa linia trendu
- Adaptacyjna MA Kaufmana z Trend Vision
- Kanał średniej kroczącej
- Pakiet średnich kroczących
- Średnia krocząca kanału trendu
Narzędzia/niestandardowe
Oparte na regresji
Zmienność
Oscylatory
__________________________________________________________________________________________
ZASTRZEŻENIE
Handel wiąże się z ryzykiem. Ten wskaźnik jest przeznaczony wyłącznie do analizy technicznej — zawsze stosuj odpowiednie zarządzanie ryzykiem i handluj odpowiedzialnie.
OPINIE I ULEPSZENIA
Jeśli masz sugestie, prośby o funkcje lub pomysły na ulepszenia, prosimy o pozostawienie komentarza na karcie Dyskusja. Twoja opinia pomaga ulepszać wskaźnik dla wszystkich.


