Descrição
Indicadores da loja Pinescriptlabs: cBots da loja Pinescriptlabs : (cBot) Gold & BTC BreakoutSession Pivots(novo)
Trailing Smart Algorithm (Novo)
Mapa de Liquidação de Alavancagem
Previsão Baseada em Linreg & ATR
Suporte & Resistência SmartTrend
Linhas
Lines
Sistema de Rompimento de Canal
Estrutura
Dinâmica do Mercado
Análise
de
Pontos
de Virada
Regressão
Linear
Fibonacci
Multi-temporal
Gap de Valor Justo de Momentum
Gradiente de Tendência Dinâmico
Rastreador
de Viés
de Vela Multi-Nível
Rastreador de Extremos Zig-Zag
Suporte
e Resistência
Automáticos
de Tendência
Linhas
Todos
os Suportes
e Resistências
Níveis
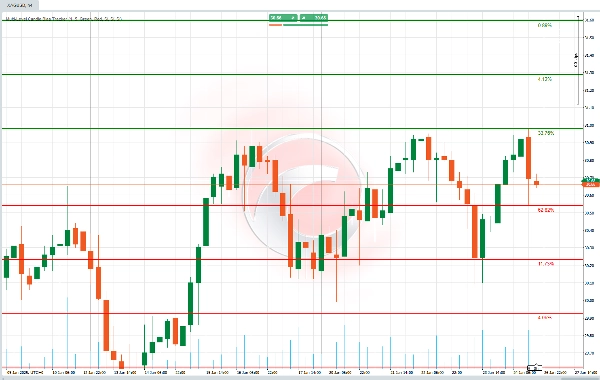
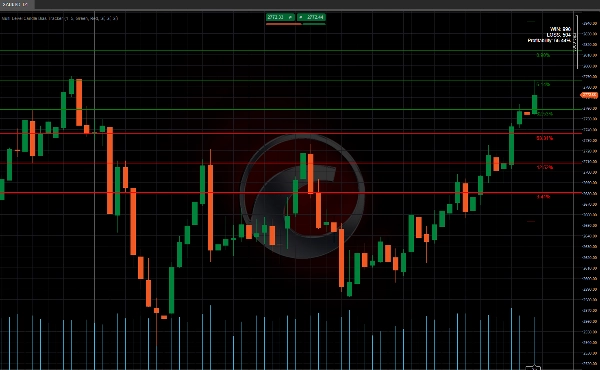
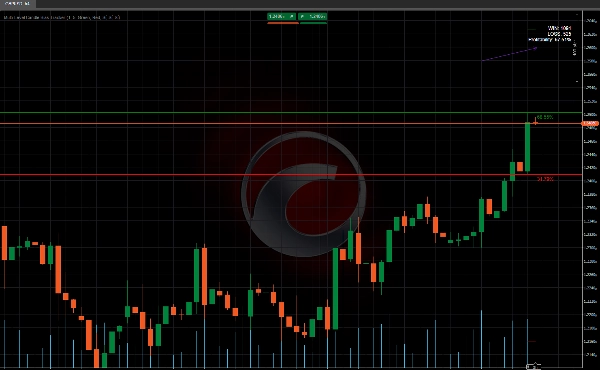
Este algoritmo determina a probabilidade do preço atingir uma nova máxima ou mínima e a representa como um nível no gráfico, acompanhado da sua porcentagem correspondente. Este cálculo é testado retrospectivamente, e os resultados são exibidos em uma tabela, facilitando a compreensão da probabilidade da próxima vela estabelecer uma nova máxima ou mínima. 📈📉
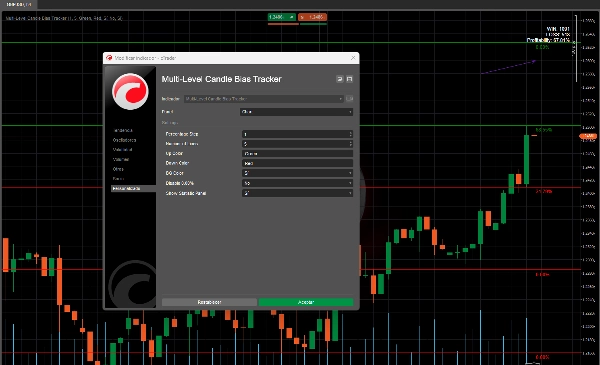
Como funciona? 🛠️
- Probabilidades de Novas Máximas e Mínimas 🎯
-
- O algoritmo analisa o comportamento passado do preço para calcular a probabilidade do preço fazer uma nova máxima ou mínima na próxima vela.
- Por exemplo, se a probabilidade de uma nova máxima é 70%, é mais provável que o preço suba. ⬆️
- Níveis com Percentuais 📏
-
- Ele desenha linhas horizontais no gráfico representando níveis-chave, junto com uma porcentagem indicando a probabilidade do preço atingir esse nível.
- Esses níveis são calculados usando uma porcentagem que você define (por exemplo, 1%).
- Painel de Estatísticas 📊
-
- Ele mostra quantas vezes o preço atingiu esses níveis (sucessos) e quantas vezes não atingiu.
- Também fornece uma porcentagem de eficácia, informando se esses níveis foram confiáveis no passado. ✅❌
Para que serve?
- Entender a direção do preço: Ajuda você a saber se o preço tem mais probabilidade de subir ou descer na próxima vela. ⬆️⬇️
- Gerenciar risco: Se um nível tem baixa probabilidade, você pode evitá-lo para reduzir decisões arriscadas.
Como você usaria?
- Observe os níveis: Olhe para as linhas que o algoritmo desenha no gráfico. 👀
- Verifique as probabilidades: Se um nível tem alta probabilidade (por exemplo, 70%), é mais provável que o preço o alcance. 📈
- Use o painel de estatísticas: Revise se esses níveis funcionaram bem no passado para decidir se você confia neles. 📊
Resumo
The indicator includes a statistics panel that shows how many times the price has successfully reached these levels versus how many times it has not, along with an effectiveness percentage reflecting the reliability of these levels based on historical data.
This tool is designed to help traders understand the likely direction of price movement in the next candle and manage risk by avoiding levels with low probabilities. Users apply it by observing the drawn levels, checking their associated probabilities, and reviewing the statistics panel to assess the historical performance of these signals.
Supported markets include commodities, cryptocurrencies (e.g., BTCUSD), and other symbols. The indicator integrates probability-based analysis into price action trading to assist in decision-making regarding potential breakout or trend continuation scenarios.
Avaliações de clientes
5 | 100 % | |
4 | 0 % | |
3 | 0 % | |
2 | 0 % | |
1 | 0 % |