
คำอธิบาย
ตัวบ่งชี้ Pinescriptlabs Store: Pinescriptlabs Store cBots : (cBot) Gold & BTC BreakoutSession Pivots(ใหม่)
Trailing Smart Algorithm(ใหม่)
SmartTrend Support &
Resistance
Lines
Dynamic
Market Structure
Analysis
of
Turning
Points
Fibonacci
Linear
Regression
Multi-timeframe
Multi-Level
Candle Bias
Tracker
Auto
Support and
Resistance
Trend
Lines
All
Support and
Resistance
Levels
ดัชนีความกลัว & ความโลภ
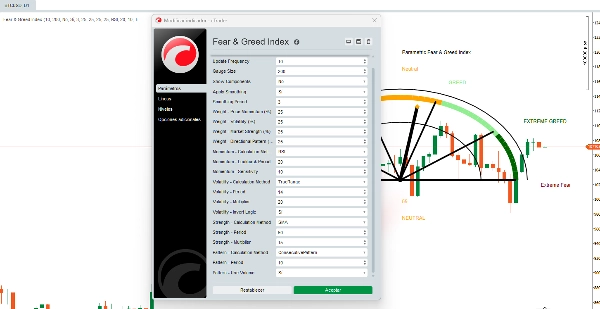
ตัวบ่งชี้ ความกลัว & ความโลภ เป็นอัลกอริทึมภาพขั้นสูงที่สังเคราะห์ความรู้สึกตลาดเป็น ค่าระหว่าง 0-100 โดยใช้ เกจแบบครึ่งวงกลม แตกต่างจากเวอร์ชันพื้นฐาน เครื่องมือนี้ ปรับแต่งได้อย่างเต็มที่ ช่วยให้เทรดเดอร์ปรับแต่งทุกแง่มุมของการคำนวณได้
📊 ส่วนประกอบหลัก 4 อย่าง (ปรับแต่งได้)
1️⃣ โมเมนตัมราคา *(น้ำหนักปรับได้: 0-100%)*
มีวิธีการคำนวณ 6 วิธี:
- PriceChange: เปอร์เซ็นต์การเปลี่ยนแปลงง่าย ๆ เทียบกับช่วงเวลาก่อนหน้า
- ROC: อัตราการเปลี่ยนแปลงที่ปรับมาตรฐาน
- RSI: RSI ที่ปรับแต่งสำหรับโมเมนตัม
- SMADeviation: ส่วนเบี่ยงเบนราคาจาก SMA
- EMADeviation: ส่วนเบี่ยงเบนราคาจาก EMA
- MACD: สัญญาณ MACD เป็นตัวบ่งชี้โมเมนตัม
🔧 พารามิเตอร์ที่ปรับแต่งได้:
- ช่วงเวลาย้อนกลับ *(5-100)*
- ความไวในการคำนวณ *(1.0-50.0)*
2️⃣ ความผันผวน *(น้ำหนักปรับได้: 0-100%)*
มีวิธีการคำนวณ 6 วิธี:
- TrueRange: ความผันผวนตาม True Range
- HighLowRange: ช่วงสูง-ต่ำแบบง่าย
- CloseToClose: ความผันผวนแบบลอการิทึมจากปิดถึงปิด
- ATR: ค่าเฉลี่ย True Range มาตรฐาน
- StandardDev: ส่วนเบี่ยงเบนมาตรฐานของราคา
- ParkinsonVol: ตัวประมาณความผันผวนแบบ Parkinson
🔧 พารามิเตอร์ที่ปรับแต่งได้:
- ช่วงเวลาคำนวณ *(5-50)*
- ตัวคูณความผันผวน *(1.0-100.0)*
- การกลับตรรกะ (ความผันผวนสูง = ความกลัวมากขึ้น)
3️⃣ ความแข็งแกร่งของตลาด *(น้ำหนักปรับได้: 0-100%)*
มีวิธีการคำนวณ 6 วิธี:
- SMA: ตำแหน่งสัมพันธ์กับค่าเฉลี่ยเคลื่อนที่แบบง่าย
- EMA: ตำแหน่งสัมพันธ์กับค่าเฉลี่ยเคลื่อนที่แบบเลขชี้กำลัง
- VWAP: ตำแหน่งสัมพันธ์กับราคาถ่วงน้ำหนักด้วยปริมาณ
- HLBand: ตำแหน่งภายในแถบสูง-ต่ำ
- BollingerPos: ตำแหน่งภายในแถบ Bollinger
- PivotDistance: ระยะทางถึงจุดหมุน
🔧 พารามิเตอร์ที่ปรับแต่งได้:
- ช่วงเวลาคำนวณ *(10-200)*
- ตัวคูณความแข็งแกร่ง *(1.0-50.0)*
4️⃣ รูปแบบทิศทาง *(น้ำหนักปรับได้: 0-100%)*
มีวิธีการคำนวณ 6 วิธี:
- BullBearRatio: อัตราส่วนแท่งเทียนกระทิง/หมี
- VolumePattern: การวิเคราะห์แนวโน้มปริมาณ
- BodySizePattern: การวิเคราะห์ขนาดตัวแท่งเทียน
- WickPattern: การวิเคราะห์รูปแบบไส้เทียน
- GapPattern: การตรวจจับและวิเคราะห์ช่องว่างราคา
- ConsecutivePattern: การวิเคราะห์การเคลื่อนไหวราคาติดต่อกัน
🔧 พารามิเตอร์ที่ปรับแต่งได้:
- ช่วงเวลาวิเคราะห์ *(5-30)*
- การใช้ปริมาณในการคำนวณ (ไม่บังคับ)
⚙️ คุณสมบัติขั้นสูง
🔹 ระบบน้ำหนักที่ยืดหยุ่น
- น้ำหนักที่กำหนดเองต่อส่วนประกอบ *(0-100%)*
- การปรับมาตรฐานอัตโนมัติหากน้ำหนักรวมไม่เท่ากับ 100%
- คำเตือนสำหรับการตั้งค่าที่ไม่เหมาะสม
🔹 การทำให้เรียบอย่างชาญฉลาด
- การทำให้เรียบแบบเลือกได้เพื่อลดเสียงรบกวน
- ช่วงเวลาการทำให้เรียบที่ปรับได้ *(1-10)*
- ตัวกรอง SMA ที่ใช้กับผลลัพธ์สุดท้าย
🔹 การแสดงผลที่ปรับแต่งได้อย่างเต็มที่
- ขนาดเกจ *(50-500px)*
- ความถี่ในการอัปเดต *(1-50 แท่ง)*
- การแยกส่วนประกอบแบบเลือกได้ (แสดงค่ารายบุคคล)
- ปรับตัวอัตโนมัติตามเครื่องมือและกรอบเวลา
🔄 กระบวนการอัลกอริทึม
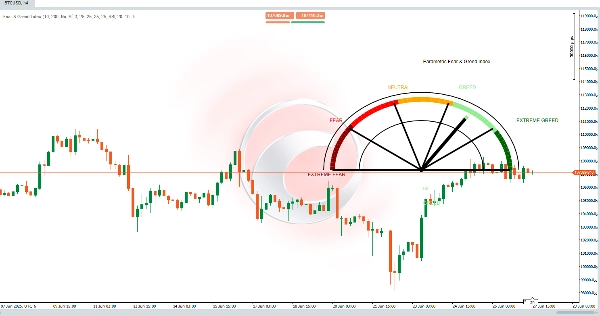
ขั้นตอนที่ 4: การแสดงผล
เกจแบบครึ่งวงกลมแสดง 5 โซนสี:
- 0-20: ความกลัวขั้นสุด
- 21-40: ความกลัว
- 41-60: เป็นกลาง
- 61-80: ความโลภ
- 81-100: ความโลภขั้นสุด
✅ ระบบที่ปรับแต่งได้อย่างเต็มที่:
🎯 ความยืดหยุ่นทั้งหมด
- ปรับตัวเข้ากับตลาดใดก็ได้: ฟอเร็กซ์, คริปโต, หุ้น, สินค้าโภคภัณฑ์
- เฉพาะกรอบเวลา: การตั้งค่าต่างกันสำหรับ การเทรดสั้นและการเทรดสวิง
- พัฒนาไปพร้อมกับตลาด: ปรับกลยุทธ์ตามสภาพตลาดที่เปลี่ยนแปลง
สรุป
รีวิวจากลูกค้า
5 | 100 % | |
4 | 0 % | |
3 | 0 % | |
2 | 0 % | |
1 | 0 % |


