คำอธิบาย
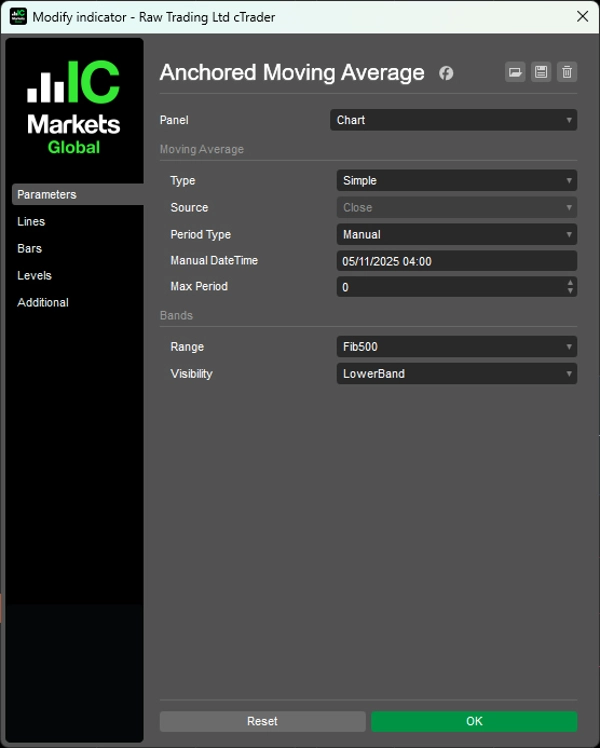
ล็อกการคำนวณค่าเฉลี่ยเคลื่อนที่กับช่วงเวลาตลาดใดก็ได้และติดตามพฤติกรรมราคาขณะที่มันขยายไปข้างหน้า
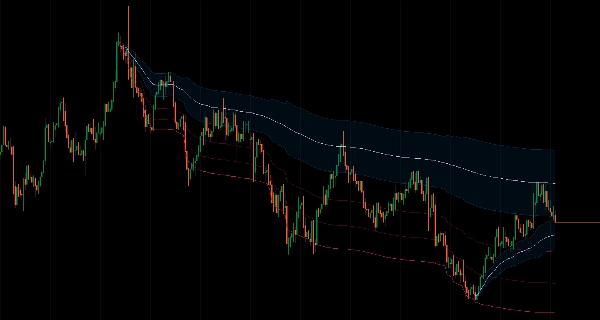
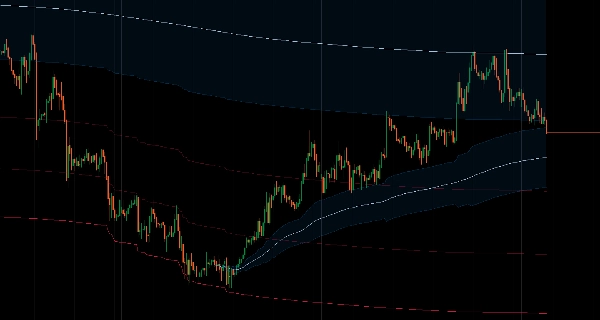
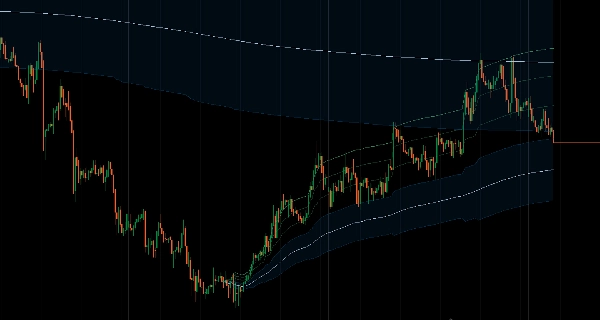
ตรึงการคำนวณไว้ที่จุดเริ่มต้นที่คุณเลือก (วันที่และเวลาที่กำหนดเองหรือช่วงเวลาย้อนหลังตั้งแต่ 1 ชั่วโมงถึง 10 ปี) จากนั้นเติบโตอย่างเป็นธรรมชาติกับแถบฟีโบนัชชีที่ปรับตัวตามช่วงราคาจริง
แปดระดับฟีโบนัชชี (11.4% ถึง 100%) ที่ปรับตัวตามการเคลื่อนไหวของราคาแบบเรียลไทม์, โซนการกลับตัวเฉลี่ยในตัวที่ 38.2%-62.8%, ประเภท MA สองแบบ (SMA/EMA), โหมดการแสดงผลหลายแบบ (แถบเต็ม, ขอบเขตสุดขีดเท่านั้น, โซนกลับตัวเท่านั้น) และตัวจำกัดช่วงเวลาสูงสุดสำหรับกรอบเวลายาว ช่วยให้การติดตามโมเมนตัมตามเหตุการณ์สำหรับเทรดเดอร์ที่มุ่งเป้าหมายการดึงกลับจากจุดสวิงสำคัญและการวิเคราะห์พฤติกรรมราคาหลังเหตุการณ์
คุณสมบัติ
การคำนวณที่ยึดตามเวลา
- แตกต่างจาก MA มาตรฐานที่ใช้ช่วงเวลาคงที่ ตัวนี้เติบโตอย่างเป็นธรรมชาติตั้งแต่จุดเริ่มต้นที่คุณเลือก
- การยึดที่ยืดหยุ่น: ตั้งวันที่และเวลาด้วยตนเองหรือใช้ช่วงเวลาย้อนหลังที่กำหนดไว้ล่วงหน้า (1 ชั่วโมงถึง 10 ปี)
- ติดตามโมเมนตัมจากช่วงเวลาตลาดที่สำคัญ
- จุดยึดที่สม่ำเสมอในกรอบเวลาต่าง ๆ
แถบฟีโบนัชชีที่ปรับตัว
- แถบที่คำนวณโดยอัตโนมัติตามช่วงราคาจริง ไม่ใช่ค่าคูณ ATR แบบสุ่ม
- 8 ระดับฟีโบนัชชี (11.4% ถึง 100%) ที่ปรับตัวตามการเคลื่อนไหวของราคาแบบเรียลไทม์
- โซนกลับตัวเฉลี่ย: โซนกลับตัวในตัวที่ 38.2%-62.8% สำหรับพื้นที่เข้าซื้อที่มีความน่าจะเป็นสูง
- โซนความน่าจะเป็นที่กำหนดทางคณิตศาสตร์
สองประเภท MA
- ค่าเฉลี่ยเคลื่อนที่แบบง่าย
- ค่าเฉลี่ยเคลื่อนที่แบบเลขชี้กำลัง
- ตัวจำกัดช่วงเวลาสูงสุด: ป้องกันการทำให้เรียบเกินไปในกรอบเวลายาว
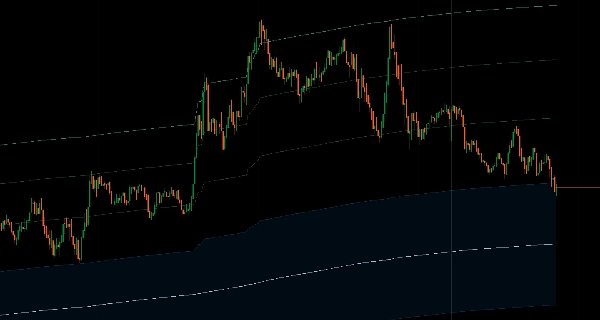
โหมดการแสดงผลหลายแบบ
- แถบเต็ม: แสดงระดับฟีโบนัชชีทั้งหมด
- แสดงเฉพาะขอบบน/ล่าง: แสดงขอบเขตสุดขีด
- แสดงเฉพาะโซนกลับตัว: เน้นพื้นที่กลับตัวเฉลี่ย
- ออกแบบเรียบง่าย มีจุดประสงค์ ไม่มีความรก
การวิเคราะห์ตามเหตุการณ์
- ดูว่าราคาปัจจุบันสัมพันธ์กับการเคลื่อนไหวจากระดับสำคัญอย่างไร
- ติดตามพฤติกรรมราคาหลังเหตุการณ์
- การเข้าซื้อที่อิงโครงสร้างพร้อมจุดอ้างอิงที่ชัดเจน
__________________________________________________________________________________________
ตัวบ่งชี้ฟรีเพิ่มเติม
สำรวจเครื่องมือวิเคราะห์ตลาดหลากหลายประเภท — ตั้งแต่โครงสร้างและปริมาณไปจนถึงการถดถอย ความผันผวน และกรอบเวลาที่กำหนดเอง
ซอร์สโค้ดมีให้บน GitHub repository.
ทั้งหมดใช้ฟรี แต่ถ้าคุณต้องการสนับสนุนด้วยกาแฟ คุณสามารถส่งได้ ที่นี่.
แนวรับ/แนวต้าน
ปริมาณ
- โปรไฟล์กิจกรรมปริมาณ
- ตัววิเคราะห์ประสิทธิภาพปริมาณ
- การวิเคราะห์โปรไฟล์ปริมาณ
- โปรไฟล์ปริมาณ - อัปเดต
- การวิเคราะห์การกระจายปริมาณ
- VWAP (ราคาถ่วงน้ำหนักด้วยปริมาณ)
ค่าเฉลี่ยเคลื่อนที่
- ช่อง SSL
- ค่าเฉลี่ยเคลื่อนที่ที่ยึดจุด
- ค่าเฉลี่ยเคลื่อนที่ที่ปรับสเกลด้วยส่วนเบี่ยงเบน
- ตัวกระตุ้น Gann High Low
- เส้นแนวโน้มทันที
- Kaufman Adaptive MA พร้อม Trend Vision
- ช่องค่าเฉลี่ยเคลื่อนที่
- ชุดค่าเฉลี่ยเคลื่อนที่
- ค่าเฉลี่ยเคลื่อนที่ช่องแนวโน้ม
ยูทิลิตี้/กำหนดเอง
การถดถอย
ความผันผวน
ออสซิลเลเตอร์
__________________________________________________________________________________________
ข้อจำกัดความรับผิดชอบ
การเทรดมีความเสี่ยง ตัวบ่งชี้นี้มีไว้สำหรับการวิเคราะห์ทางเทคนิคเท่านั้น — โปรดใช้การจัดการความเสี่ยงอย่างเหมาะสมและเทรดอย่างรับผิดชอบเสมอ
คำติชม & การปรับปรุง
หากคุณมีข้อเสนอแนะ คำขอฟีเจอร์ หรือไอเดียสำหรับการปรับปรุง โปรดแสดงความคิดเห็นในแท็บ Discussion คำติชมของคุณช่วยปรับปรุงตัวบ่งชี้สำหรับทุกคน
สรุป
The indicator features adaptive Fibonacci bands calculated based on the actual price range, not arbitrary multiples. It includes eight Fibonacci levels from 11.4% to 100%, with a built-in mean reversion zone between 38.2% and 62.8%, providing mathematically defined probability zones for potential entry areas. Multiple display modes are available, including full bands, extreme boundaries only, or reversion zone only, designed for a clean and purposeful chart presentation.
This tool facilitates analysis of price behavior relative to significant swing points or events, supporting structured entries and post-event price tracking. It is intended for technical analysis and includes a disclaimer advising responsible trading with proper risk management.
รีวิวจากลูกค้า
5 | 100 % | |
4 | 0 % | |
3 | 0 % | |
2 | 0 % | |
1 | 0 % |


!["[Stellar Strategies] MARSI Signal Plotter" โลโก้](https://cdn.ctrader.com/image/webp/7b2b8da6-8f8e-4646-8d4a-4710c516c01e_25567)