
Mô tả
Chỉ báo cửa hàng Pinescriptlabs: cBots cửa hàng Pinescriptlabs : (cBot) Gold & BTC BreakoutSession Pivots(mới)
PRICE ACTION (Mới)
Thuật toán thông minh theo dõi (Mới)
Hỗ trợ &
Kháng cự SmartTrend
Đường
Phiên khoảng trống giá trị công bằng
Phân tích
Cấu trúc thị trường
Động
của
Điểm
Quay đầu
Hồi quy tuyến tính Fibonacci
đa khung thời gian
Multi-timeframe
Khoảng trống giá trị công bằng động lực
Tự động
Hỗ trợ và
Kháng cự
Xu hướng
Đường
Mô tả:
Hệ thống giao dịch mua & bán xu hướng HTF nâng cao
Nó là gì và dùng để làm gì?
Nó là một thuật toán phân tích kỹ thuật tự động xác định các mức hỗ trợ và kháng cự 📈 dựa trên phạm vi giá lịch sử, và phát hiện khi giá phá vỡ các mức này để tạo ra tín hiệu xu hướng 💡.
Logic hoạt động như thế nào?
1️⃣ Tính toán phạm vi
Chỉ báo phân tích một khoảng thời gian lịch sử được xác định (có thể cấu hình hoàn toàn) để tìm:
• Giá cao nhất đạt được trong khoảng thời gian đó 📊
• Giá thấp nhất đạt được trong khoảng thời gian đó 📉
• Điểm giữa giữa hai mức đó ⚖️
2️⃣ Thiết lập mức
Khi các cực trị được xác định, chỉ báo:
• Vẽ một đường màu đỏ tại mức tối đa (kháng cự)
• Vẽ một đường màu xanh lá tại mức tối thiểu (hỗ trợ)
• Thêm một bộ đệm an toàn cho mỗi mức để ngăn tín hiệu giả 🛡️
3️⃣ Phát hiện phá vỡ
Hệ thống liên tục theo dõi giá để phát hiện:
• Phá vỡ tăng giá 🚀: khi giá đóng cửa trên mức kháng cự + bộ đệm
• Phá vỡ giảm giá 🐻: khi giá đóng cửa dưới mức hỗ trợ - bộ đệm
4️⃣ Hệ thống xác nhận
Trước khi tạo tín hiệu cuối cùng ✅, chỉ báo:
• Chờ một số thanh liên tiếp có thể cấu hình được xác nhận phá vỡ ⏳
• Chỉ sau khi xác nhận mới chính thức thay đổi xu hướng
5️⃣ Cập nhật động
Các mức được tính toán lại tự động:
• Khi một khoảng thời gian mới bắt đầu (hàng ngày, hàng tuần hoặc hàng tháng, tùy theo cài đặt của bạn) 🔄
• Các đường kéo dài cho đến khi các mức mới được thiết lập
• Đường điểm giữa thay đổi màu sắc theo xu hướng hiện tại
Cách sử dụng ?
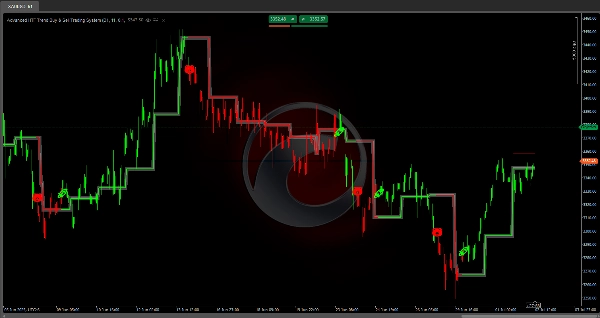
✨ Tín hiệu:
• Mua: Biểu tượng 🚀 xuất hiện khi một phá vỡ tăng giá được xác nhận
• Bán: Biểu tượng 🐻 xuất hiện khi một phá vỡ giảm giá được xác nhận
🎨 Tô màu nến:
• Nến được tự động tô màu theo xu hướng hiện tại:
✅ Xanh lá: Xu hướng tăng đang hoạt động
❌ Đỏ: Xu hướng giảm đang hoạt động
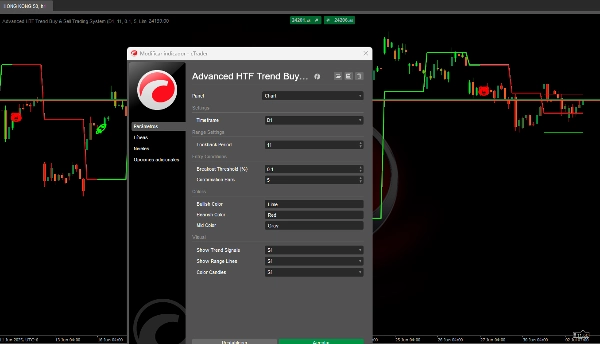
Cài đặt tham số
🔧 Khoảng thời gian nhìn lại (5–200, mặc định: 11)
Nó kiểm soát điều gì?
Số lượng thanh lịch sử được sử dụng để tính giá cao và thấp.
Ảnh hưởng khi thay đổi:
• Giá trị thấp (5–15):
- Các mức phản ứng nhanh và thường xuyên hơn
- Số lượng tín hiệu cao hơn
- Phù hợp nhất cho giao dịch lướt sóng và ngắn hạn
- Lý tưởng cho thị trường biến động cao
• Giá trị cao (30–50):
- Các mức ổn định và bền vững hơn 🏛️
- Ít tín hiệu nhưng đáng tin cậy hơn
- Tốt hơn cho giao dịch swing và vị thế trung hạn
- Lý tưởng cho thị trường ổn định hơn
📏 Ngưỡng phá vỡ (0.01–5.0%, mặc định: 0.1%)
Nó kiểm soát điều gì?
Bộ đệm bổ sung mà giá phải vượt qua để xác nhận một phá vỡ.
Ảnh hưởng khi thay đổi:
• Giá trị thấp (0.05–0.15%):
- Tín hiệu sớm và nhạy hơn 🔍
- Rủi ro cao hơn về phá vỡ giả
- Lý tưởng cho Forex majors với chênh lệch thấp
- Tốt nhất cho thị trường thanh khoản cao
• Giá trị cao (0.3–1.0%):
- Tín hiệu muộn hơn nhưng đáng tin cậy hơn 🛡️
- Giảm rủi ro nhiễu thị trường
- Lý tưởng cho tiền điện tử và tài sản biến động
- Tốt nhất cho thị trường có chênh lệch rộng hơn
⏳ Số thanh xác nhận (1–5, mặc định: 1)
Nó kiểm soát điều gì?
Có bao nhiêu thanh liên tiếp phải xác nhận phá vỡ trước khi tạo tín hiệu.
Ảnh hưởng khi thay đổi:
• 1 thanh:
- Tín hiệu tức thì ⚡
- Nhiều cơ hội giao dịch hơn
- Rủi ro cao hơn về tín hiệu sớm
- Lý tưởng cho nhà giao dịch năng động
• 2–3 thanh:
- Cân bằng giữa tốc độ và độ tin cậy ⚖️
- Giảm đáng kể tín hiệu giả
- Lý tưởng cho hầu hết các chiến lược
• 4–5 thanh:
- Tín hiệu rất bảo thủ 🕊️
- Độ tin cậy tối đa
- Có thể bỏ lỡ cơ hội sớm
- Lý tưởng cho vị thế dài hạn
📊 Tối ưu hóa theo loại tài sản
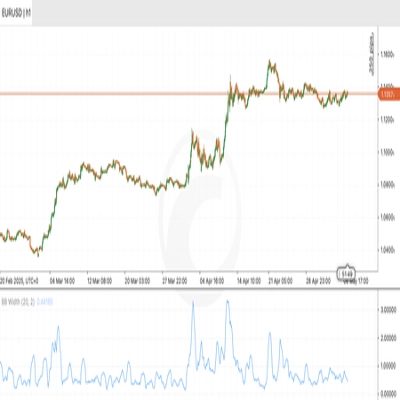
💱 Forex Majors (EUR/USD, GBP/USD, v.v.)
• Khoảng thời gian nhìn lại: 15–25
• Ngưỡng: 0.05–0.15%
• Xác nhận: 1–2 thanh
💰 Tiền điện tử
• Khoảng thời gian nhìn lại: 10–20
• Ngưỡng: 0.2–0.8%
• Xác nhận: 2–3 thanh
📈 Chỉ số chứng khoán
• Khoảng thời gian nhìn lại: 20–30
• Ngưỡng: 0.1–0.3%
• Xác nhận: 1–2 thanh
🌾 Hàng hóa
• Khoảng thời gian nhìn lại: 25–35
• Ngưỡng: 0.15–0.4%
• Xác nhận: 2–3 thanh
Những điều cần lưu ý
• Có thể tạo ra tín hiệu muộn trong các thị trường di chuyển rất nhanh 🏃♂️
• Kém hiệu quả hơn trong thị trường đi ngang cực đoan
• Cần điều chỉnh tham số tùy thuộc vào tài sản và khung thời gian ⏱️
Tóm tắt
The system continuously monitors price action to detect bullish breakouts (price closing above resistance plus buffer) and bearish breakouts (price closing below support minus buffer). It includes a confirmation mechanism that waits for a configurable number of consecutive bars confirming the breakout before officially signaling a trend change. The midpoint line changes color to reflect the current trend, and all levels update dynamically at the start of new periods (daily, weekly, or monthly).
Signals are visually indicated with symbols: a rocket (🚀) for confirmed bullish breakouts and a bear (🐻) for confirmed bearish breakouts. Candles are colored green for active bullish trends and red for bearish trends.
Key adjustable parameters include lookback period (5–200 bars), breakout threshold buffer (0.01–5.0%), and confirmation bars (1–5). These settings can be optimized for various asset types such as Forex majors, cryptocurrencies, stock indices, and commodities, balancing signal frequency, reliability, and market conditions. The indicator supports multiple timeframes and is suitable for scalping, swing trading, and longer-term strategies depending on configuration.