
الوصف
▁▂▃▄▅▆▇ █ أكثر من 10,000 متداول (مؤسسي + تجزئة) █ ▇▆▅▄▃▂▁
- اختر أفضل مؤشراتنا في cTrader 🏆
- ✨ دقة حصرية لنتائج متفوقة ✨
- 📈 خوارزمياتنا — مع أفضل المرئيات تقييمًا 🎯—
- تم تنفيذها بنجاح في صندوقين كميين
▁▂▃▄▅▆▇ █████████████████████████████ ▇▆▅▄▃▂▁
_______________________________________________
_______________________________________________
📌 مؤشرات هيكل السوق
· ✅ هيكل السوق المتقدم: Bos, Choch, SwinLevels, كتل الأوامر، هيكل السوقوآداة إيجاد السيولة
· 🔄تحليل هيكل السوق الديناميكي لنقاط التحول
· 🧱 كتلة الأوامر
· ⚖️ اختلال السوق
· ⛓️ BOS & CHOCH
· 🧠 قوة ICT 3
______________________________________________________________-
متجر cBots : 🧠 اختراق الذهب و BTCمحاور الجلسة 🧠
_______________________________________________
🔚 أنظمة الخروج الذكية
_______________________________________________
📐 مؤشرات ZigZag
· ➖ ZigZag
_______________________________________________
🧱 مؤشرات الدعم والمقاومة
· 🟩 خطوط دعم ومقاومة SmartTrend
· 🧱 جميع مستويات الدعم والمقاومة
_______________________________________________
📊 مؤشرات الاتجاه والقناة
· 📊 سوبرتريند
· ⭐ قناة SSL المميزة
_______________________________________________
💧 أدوات الحجم والسيولة
· 📉 خريطة تصفية الرافعة المالية
_______________________________________________
⚡ مؤشرات الزخم و RSI
· 📈 مُشغل اتجاه RSI
· 🔎 متعقب ميل الشمعة متعدد المستويات
_______________________________________________
🔮 أدوات التنبؤ والإسقاط
· 📐 التنبؤ بناءً على Linreg& ATR
· 📏 انحدار خطي فيبوناتشي متعدد الأطر الزمنية
· 📈 عارض تدفق السوق المدعوم بالحجم
______________________________________________________________________________________________________
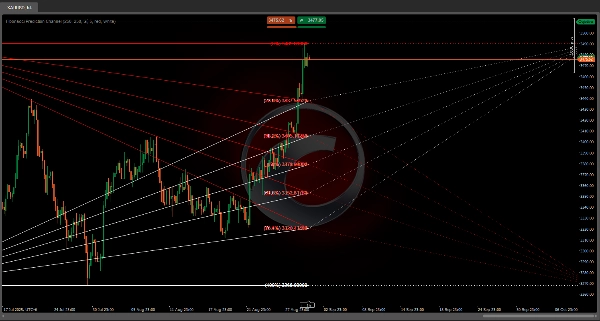
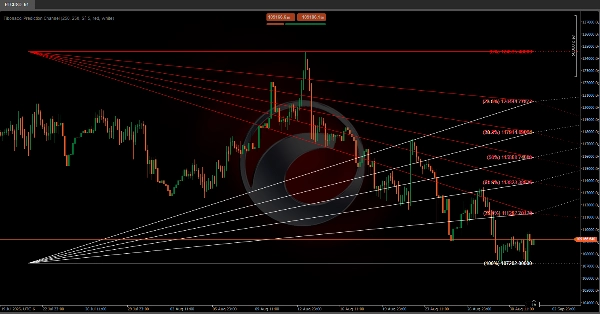
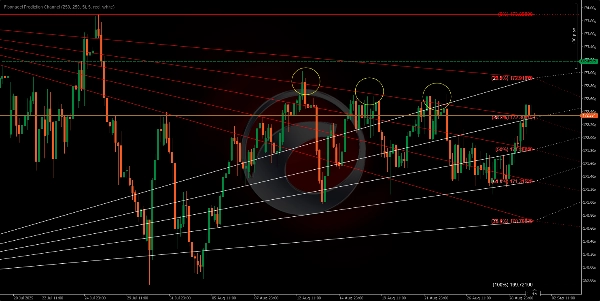
تم تصميم هذه الخوارزمية لرسم قناة توقع مستقبلية بناءً على مستويات فيبوناتشي 📊✨. خطوط فيبوناتشي تخلق سلسلة من القنوات المتوازية بين كل زوج من المستويات المتتالية. يمكن تفسير هذه القنوات كنطاقات يتوقع أن يتقلب السعر ضمنها 📈📉، مما يولد مخروط بصري حيث سيتفاعل السعر 🎯. إذا تم كسر مستوى ⚡، سننتقل إلى المستوى التالي.
تعمل هذه المستويات، التي نتوقعها في المستقبل، أيضًا كـ دعم ومقاومة 🛡️⚔️، مما يخلق قنوات بصرية على الرسم البياني يمكن أن تساعدنا في التنبؤ والتخطيط للإجراءات 🧠✅ بناءً على كيفية تفاعل السعر مع هذه المستويات في الماضي.
يمكننا توقع رد فعل السعر عند اقترابه من هذه الخطوط 🔍، ربما الارتداد داخل القناة 🔄 أو، إذا كان هناك ما يكفي من الزخم 🚀، اختراق الخطوط للانتقال إلى القناة التالية.
المستويات المتوقعة إلى اليمين ➡️🗓️ ليست مبنية على بيانات سعر جديدة ولكن على حركة السعر الماضية ⏳. تمتد إلى المستقبل كنوع من "خريطة" 🗺️ لتفاعلات سعر محتملة في المستقبل.
الأشرطة التاريخية ⏰: تحدد عدد فترات السعر الماضية التي سيتم أخذها في الاعتبار عند حساب مستويات تصحيح فيبوناتشي.


![شعار "[Hamster-Coder] Moving Average MTF"](https://cdn.ctrader.com/image/webp/b11b98b1-194d-4b8e-b00e-d611826ad159_31226)


