
الوصف
🚀 أكثر من 10,000 متداول يستخدمون بالفعل أفضل المؤشرات🏆
👉 احصل على جميع أنظمتنا الأفضل هنا:
_______________________________________________
📌 مؤشرات هيكل السوق
· ✅ هيكل السوق المتقدم: Bos, Choch, SwinLevels, Order Blocks, هيكل السوق & مكتشف السيولة
· 🔄تحليل هيكل السوق الديناميكي لنقاط التحول
· 🧱 كتلة الأوامر
· ⚖️ اختلال السوق
· ⛓️ BOS & CHOCH
· 🧠 قوة ICT 3
_______________________________________________
🔚 أنظمة الخروج الذكية
_______________________________________________
📐 مؤشرات ZigZag
· ➖ ZigZag
_______________________________________________
🧱 مؤشرات الدعم والمقاومة
· 🟩 خطوط دعم ومقاومة SmartTrend
· 🧱 جميع مستويات الدعم والمقاومة
_______________________________________________
📊 مؤشرات الاتجاه والقناة
· 📊 سوبرتريند
· ⭐ قناة SSL المميزة
_______________________________________________
💧 أدوات الحجم والسيولة
· 📉 خريطة تصفية الرافعة المالية
_______________________________________________
⚡ مؤشرات الزخم و RSI
· 📈 مُشغل اتجاه RSI
· 🔎 انحياز الشمعة متعدد المستويات
متعقب
_______________________________________________
🔮 أدوات التنبؤ والإسقاط
· 📐 التنبؤ بناءً على Linreg& ATR
· 📏 انحدار خطي فيبوناتشي متعدد الأطر الزمنية
· 📈 عارض تدفق السوق المدعوم بالحجم
________________________________________________________________________________________
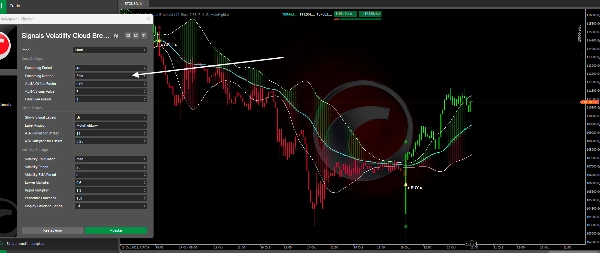
إشارات اختراق سحابة تقلبات السوق.
نظرة عامة عامة 💡
أشرطة الاتجاه التكيفية هي مؤشر متقدم يتبع الاتجاه يجمع بين ترشيح السعر التكيفي وأشرطة التقلب الديناميكية. على عكس مؤشرات الأشرطة الثابتة التقليدية، يقوم هذا النظام بضبط حساسيته تلقائيًا وفقًا لظروف السوق المتغيرة، مما يوفر إشارات أكثر دقة في بيئات تقلب مختلفة. 🎯
ماذا يفعل هذا المؤشر؟ 🤔
ينشئ المؤشر تمثيلًا مرشحًا وناعمًا للسعر (OHLC) يقضي على ضوضاء السوق، مما يسمح برؤية الاتجاه الأساسي بوضوح أكبر. في الوقت نفسه، يحسب أشرطة علوية وسفلية تتوسع أو تنقبض تلقائيًا بناءً على التقلب الحالي، متكيفًا مع الأسواق الهادئة أو المضطربة. 🌊
الميزات الرئيسية: ✨
- ترشيح السعر التكيفي باستخدام خوارزميات ALMA أو EMA
- أشرطة تقلب تعدل ديناميكيًا باستخدام النسب المئوية التاريخية
- إشارات شراء/بيع بصرية عند عبور السعر للأشرطة 🟢🔴
- تلوين الشموع بناءً على الاتجاه المكتشف (أخضر صاعد / أحمر هابط)
- سحب سحابية ملونة بين الخطوط المفلترة لتصور قوة الاتجاه 💪
كيف يعمل؟ ⚙️
نظام الترشيح
يطبق المؤشر عملية تنعيم من مرحلتين على السعر:
- الطبقة الأولى: يستخدم ALMA (المتوسط المتحرك أرنو ليجو) أو مرشحات EMA التقليدية للقضاء على التقلبات قصيرة الأجل. ALMA فعال بشكل خاص لأنه يقلل من التأخير مع الحفاظ على النعومة.
- الطبقة الثانية: يطبق تنعيم EMA إضافي على نتيجة المرشح الأول، مما يخلق خط اتجاه ناعم للغاية يتفاعل بطريقة متوازنة مع تغيرات السعر.
حساب التقلب التكيفي 📏
يقيس النظام تقلب السوق باستخدام طريقتين:
- الانحراف المعياري (StdDev): طريقة قياس التشتت الكلاسيكية
- متوسط الانحراف المطلق (MAD): أكثر متانة ضد القيم القصوى
يتم تنعيم التقلب المحسوب ثم مقارنته بتاريخ تقلبات سابقة لتحديد ترتيبه النسبي. يتحكم هذا الترتيب النسبي في مضاعف الأشرطة:
- تقلب منخفض (ترتيب نسبي منخفض): الأشرطة أقرب إلى السعر 🤏
- تقلب مرتفع (ترتيب نسبي مرتفع): الأشرطة أوسع، مما يتيح مجالًا للحركة 🌐
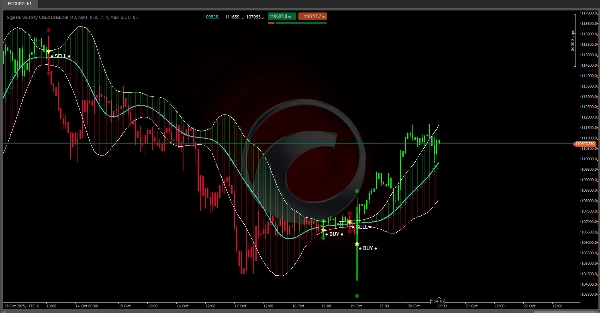
توليد الإشارات 🔔
تُفعّل الإشارات عندما يعبر السعر الفعلي الأشرطة التكيفية:
- بمجرد تفعيل إشارة، يحافظ المؤشر على حالة الاتجاه حتى يحدث عبور معاكس، مما يمنع الإشارات المبكرة في مناطق التوحيد. 🛡️
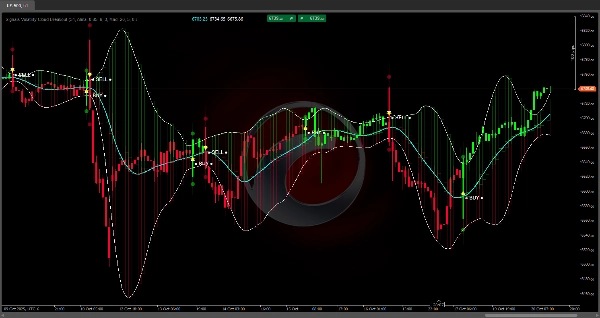
ما هو استخدامه؟ 🛠️
تحديد الاتجاه 👀
يقوم المؤشر بتلوين الشموع وفقًا لاتجاه الاتجاه المكتشف، مما يتيح لك التعرف بسرعة على ما إذا كان السوق في مرحلة صعودية أو هبوطية. تعزز السحب الملونة بين الخطوط المفلترة بصريًا قوة واتجاه الحركة.
نقاط الدخول والخروج ➡️🚪
تشير إشارات الشراء/البيع المميزة بأيقونات بارزة إلى اللحظات المحتملة لدخول أو خروج السوق. تسعى هذه الإشارات إلى التقاط بداية الاتجاهات عندما يظهر السعر زخمًا كافيًا لتجاوز الأشرطة التكيفية.
إدارة المراكز 💼
تعمل الأشرطة العلوية والسفلية كمستويات مرجعية لـ:
- تحديد نقاط وقف ديناميكية
- تحديد مناطق تشبع الشراء/البيع النسبية 🏷️
- تقييم ما إذا كان الاتجاه يفقد قوته (تراجع السعر نحو الخط المركزي) 📉
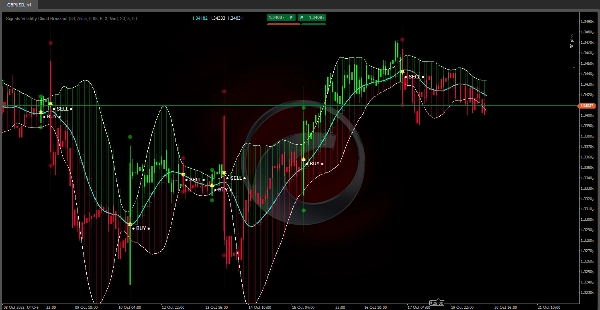
الملخص
Key features include visual BUY/SELL signals triggered when price crosses the adaptive bands, candle coloring to indicate bullish or bearish trends, and colored clouds between filtered lines to represent trend strength. The bands also serve as dynamic reference levels for setting stops, identifying overbought or oversold conditions, and assessing trend strength. This indicator supports various markets including Forex, Crypto, Stocks, and symbols such as BTCUSD, EURUSD, GBPUSD, XAUUSD, and USDJPY. It is intended for trend identification, entry and exit timing, and position management within diverse trading environments.


