Broker und Props
Für Unternehmen
00
Days
:
00
Hours
:
00
Minutes
:
00
Seconds
Indikator
RSI
Breakout
XAUUSD
ATR
Commodities
Supertrend
EURUSD
Crypto
BTCUSD
Multi-Asset Performance Matrix
5.0
03/09/2025
123
Desktop
Seit 03/10/2024
Verkäufe
116
Kostenlose Installationen
20493
In „Multi-Asset Performance Matrix“ hochgeladenes BildIn „Multi-Asset Performance Matrix“ hochgeladenes Bild

Pinescriptlabs Store indicators:                        🤖Pinescriptlabs  Store cBots :  (cBot) Gold & BTC BreakoutSession Pivots(new)

S&R Structural ZigZag                                

ZigZag

 BOS & CHOCH

Zones Supply Demand

Leverage Liquidation Map

Auto-Trend Channel


Volume POC Heatmap


PREMIUM SSL CHANNEL

Prediction Based on Linreg & ATR

 ICT Power of 3 
                                                   

SmartTrend Support &
Resistance
Lines
       

Fair Value Gap Sessions                


RSI Trend Trigger

Channel Breakout System

Supertrend

Market Imbalance

Adaptive Trend Channel 

Dynamic
Market Structure
Analysis
of
Turning
Points

Order Block

Fibonacci
Linear
Regression
Multi-timeframe

Dynamic RSI

Momentum Fair Value Gap

Market Flow Projection

Dynamic Trend Gradient

Multi-Level
Candle Bias
Tracker

Zig-Zag Extremity Tracker

Reactive Moving Average

Auto
Support and
Resistance
Trend
Lines

All
Support and
Resistance
Levels

Dynamic Range Momentum


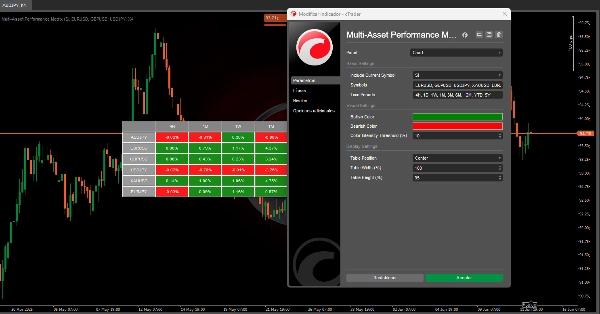
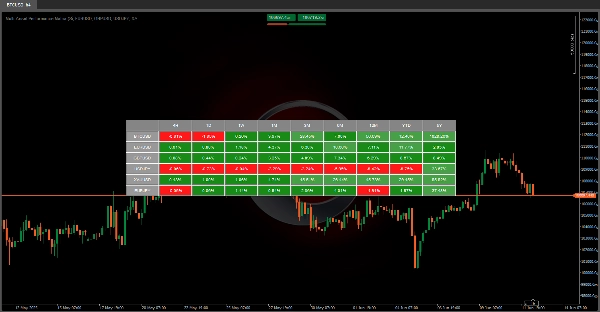
🚀 MULTI ASSET PERFORMANCE MATRIX 🚀

This algorithm is a powerful visual tool 📊 designed to display the percentage performance of multiple financial instruments across different time periods.
It transforms historical data into an efficient and intuitive visualization, allowing users to quickly assess the behavior of various financial assets.

❓ What Does This Tool Do?

1️⃣ 📈 Compares Assets: Shows how the prices of different financial instruments (like BTCUSD, EURUSD, XAUUSD, etc.) have changed over time.

  • Timeframes: D (Daily) | 1W (Weekly) | 1M (Monthly) | 3M (Quarterly) | 6M (Semi-Annual) | 12M (Annual) | YTD (Year-to-Date) | 5Y (Last 5 Years)

2️⃣ 🎨 Highlights Trends: Uses color-coding (🟢, 🔴 ) to instantly identify which assets are rising or falling in each period.

3️⃣ ⏱️ Auto-Updates: Refreshes data every minute to reflect the latest market information.

💡 Why Is This Useful?

✔ 📊 Comparative Analysis: Enables side-by-side comparisons of multiple assets—ideal for portfolio management or selecting top-performing assets based on time horizons.

✔ 🛡️ Control: Evaluating an asset’s consistency (or volatility) across different periods helps assess associated risks.

✨ Key

✅ ⏳ Saves Time: Manually collecting and calculating this data would take hours—this tool does it instantly!
✅ 👀 Visually Clear: The color-coded system makes analysis easy, even for non-technical users.
✅ 🔄 Adaptable: Supports custom symbols, so you can track the assets that matter to you.

5.0
Bewertungen: 1
5
100 %
4
0 %
3
0 %
2
0 %
1
0 %
Kundenbewertungen
June 18, 2025
I see there is problem or error when adding 1H timeframe Great work! thanks a lot.
Mehr von diesem Autor
Indikator
RSI
Breakout
XAUUSD
+6
ZigZag
ZigZag filters noise, spots trends, patterns, pivots, aiding analysis, trade management, and confirmations. 📉📈
Indikator
RSI
Breakout
XAUUSD
+6
Order Block
Identify bullish and bearish Order Blocks to spot key support/resistance levels and potential trend reversals! 📈🔄
Indikator
RSI
Breakout
XAUUSD
+5
Auto-Trend Channel
Adaptive trend channel using linear regression and Pearson correlation for dynamic support, resistance, and trends.
Indikator
RSI
XAUUSD
Breakout
+5
BOS & CHOCH
Market structural patterns , specifically the concepts of Change of Character (ChoCH) 🔄 and Break of Structure (BoS) 💥
Indikator
RSI
Breakout
XAUUSD
+6
Volume POC Heatmap
📊 Shows volume by price levels, highlights POC, and key zones. Identifies dynamic support/resistance and imbalances.
Indikator
RSI
Breakout
Supertrend
All Support and Resistance Levels
"Identify key market zones and visualize support/resistance from multiple timeframes on a single chart.
Indikator
RSI
Breakout
XAUUSD
+5
Zones Supply Demand
📊Zones Supply & Demand: Identifies key price levels with high volume concentration, marking Supply/Demand Zones & Marke
Indikator
RSI
Breakout
XAUUSD
+5
Supertrend
💹 Define a price channel 📈 and determine trend direction (bullish 🟢 or bearish 🔴).
Indikator
RSI
Breakout
XAUUSD
+6
Fair Value Gap Sessions
identify and highlight temporary market inefficiencies known as "fair value gaps" 🚨 within specific trading Sessions.
Indikator
RSI
Breakout
XAUUSD
+4
Dynamic Market Structure Analysis of Turning Points
Identify market structure effortlessly with swing highs, lows, CHoCH, and BOS levels for smart trading decisions! 📊🔍"
Indikator
Indices
RSI
XAUUSD
+7
RSI Divergence
Detects bullish and bearish divergences
Indikator
RSI
Breakout
Supertrend
Trend Heikin Multi MA
🚀 TrendHeikinMultiMA: Advanced trend detection using Heikin-Ashi smoothing & MAs! Eliminates noise, confirms real trend
Indikator
RSI
Breakout
XAUUSD
+4
Multi-Level Candle Bias Tracker
Price direction by calculating the probability of reaching new highs/lows. Shows levels & stats📈
Advanced Market Structure Bos,Choch,SwinLevels, Order Blog
Advanced price action tool that combines multiple technical analysis concepts
Indikator
RSI
Breakout
Supertrend
Market Trend OB
Price action to detect when the market changes trend (MSB) and defines, order blocks , ZigZag etc.📊
Indikator
RSI
Breakout
Supertrend
Leverage Liquidation Map
📊 Liquidation Map: Potential areas where highly leveraged investors might face liquidations.
Indikator
RSI
Breakout
Supertrend
Swing Levels
🔍 Automatically detect support and resistance levels based on "swings" or pivots
Indikator
RSI
Breakout
Supertrend
Zig-Zag Extremity Tracker
Dynamically adjusts regression channels based on ZigZag extremes, resetting when price breaks bands to track real trends
Das könnte Sie auch noch interessieren
Indikator
Breakout
ATR
Forex
+2
RangeFilter FREE Adaptive PriceFilter lite version
Lightweight adaptive filter with dynamic bands. Clean, noise-free trend structure.
Indikator
XAUUSD
Commodities
FVG_tidypips
A Fair Value Gap (FVG) indicator that identifies potential price imbalances, potential reversal and continuation zones
Indikator
Indices
Breakout
Prop
+9
IBS Indicator
IBS Indicator – Measures price position within bars for smarter trades. Works on all markets & timeframes.
Indikator
Breakout
Bollinger
Pressure Scanner
Pressure Scanner is a volatility-and-momentum to show both pressure states (squeeze on/off) and directional
Indikator
NAS100
NZDUSD
XAUUSD
+14
ZIG ZAG Free
ZigZag Free is a clean swing-detection tool that marks significant pivot highs/lows
IR Slowing Moving
Add Slowing to IR Moving Average.
FlexVWAPBand
Ultra-Flexible VWAP Indicator with Advanced Customization
Indikator
RSI
Commodities
Signal
+1
Dot Momentum %BB Indicator
Dynamic circles visualize price's volatility position. Like RSI for market overextension & stretch. Quantify context.
Fury Team E_M_A_su_TF
EMA ON TF (MULTI-TIMEFRAME)
Indikator
Breakout
Commodities
Forex
+3
MAGIC BLOCK STRATEGY
Block Liquidity,indicator.Block Order, Liquids Stops, Signal Sentiment,signal correction
Indikator
Indices
Stocks
Forex
+4
MACD Pro Trader
🚀 MACD Pro Trader – Advanced MACD with buy/sell signals, custom MAs & color-coded histograms for smarter trading! 📈🔥
VegaXLR - RSI and StochRSI Alerts
VegaXLR's cTrader StochRSI identifies overbought/oversold RSI levels for precise trade entries.
Chaikin Money Flow
Chaikin money flow's primary purpose is to distinguish between periods of accumulation and distribution of a security.
CRT Pattern Indicator
The CRT indicator helps ICT traders identify candlestick patterns, enhancing analysis of higher timeframe on lower
Indikator
XAUUSD
Breakout
Stocks
+6
Final Moving Average
Final Moving Average is an adaptive system designed to keep traders aligned with the true direction of the market
Indikator
Commodities
Forex
Crypto
+1
timer
This is a simple indicator to show the remaining time of a candle
Indikator
Indices
ATR
Forex
+1
FREE Risk Reward Guardian Scalping Swing Intraday Assistant
Trade fearlessly: auto-adjusts order blocks, manages risks, and ensures precision. Was Free for early users now -80%
Indikator
Indices
Prop
Commodities
+3
Camarilla 1.5 BT
Camarilla by Bullitt Traders — a precise, non-repainting pivot indicator for cTrader.