
Opis
▁▂▃▄▅▆▇ █ 10 000+ traderów (instytucjonalnych + detalicznych) █ ▇▆▅▄▃▂▁
- Wybierz nasze NAJLEPSZE wskaźniki w cTrader 🏆
- ✨ Ekskluzywna precyzja dla lepszych wyników ✨
- 📈 Nasze algorytmy — z najwyżej ocenianymi wizualizacjami 🎯—
- zostały pomyślnie wdrożone w 2 funduszach kwantowych
▁▂▃▄▅▆▇ █████████████████████████████ ▇▆▅▄▃▂▁
_______________________________________________
_______________________________________________
📌 Wskaźniki Struktury Rynku
· ✅ AdvancedMarket Structure: Bos, Choch, SwinLevels, Order Blocks, Market Structure& Liquidity Finder
· 🔄 Dynamic Market StructureAnalysis of Turning Points
· 🧱 Order Block
· ⚖️ Market Imbalance
· ⛓️ BOS & CHOCH
· 🧠 ICT Power of 3
______________________________________________________________-
Sklep cBots : 🧠 Gold & BTC BreakoutSession Pivots 🧠
_______________________________________________
🔚 Inteligentne Systemy Wyjścia
_______________________________________________
📐 Wskaźniki ZigZag
· 🔍 ZigZag Price LiquidityProjection
· ➖ ZigZag
_______________________________________________
🧱 Wskaźniki Wsparcia i Oporu
· 🟩 SmartTrend Support &Resistance Lines
· 🧱 All Support and ResistanceLevels
_______________________________________________
📊 Wskaźniki Trendu i Kanału
· 📊 Supertrend
_______________________________________________
💧 Narzędzia Wolumenu i Płynności
_______________________________________________
⚡ Wskaźniki Momentum i RSI
· 🔎 Multi-Level Candle BiasTracker
_______________________________________________
🔮 Narzędzia Prognozowania i Projekcji
· 📐 Prognoza oparta na Linreg& ATR
· 📏 Fibonacci Linear RegressionMulti-timeframe
· 📈 Projektor przepływu rynku zasilany wolumenem
______________________________________________________________________________________________________
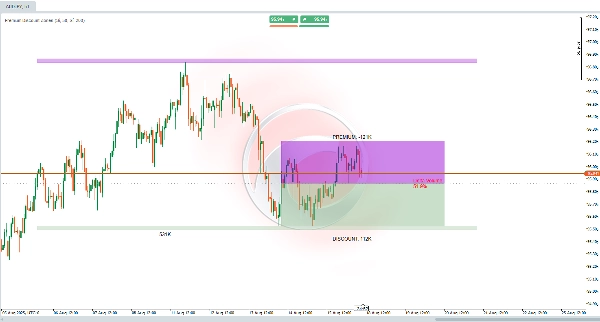
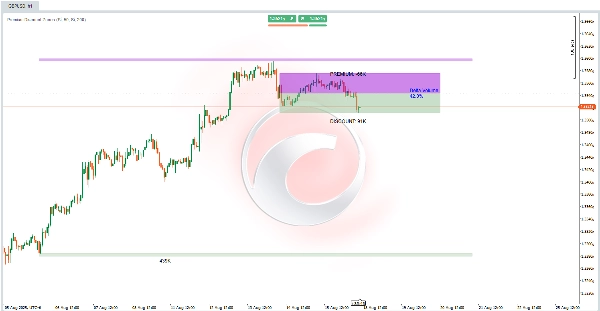
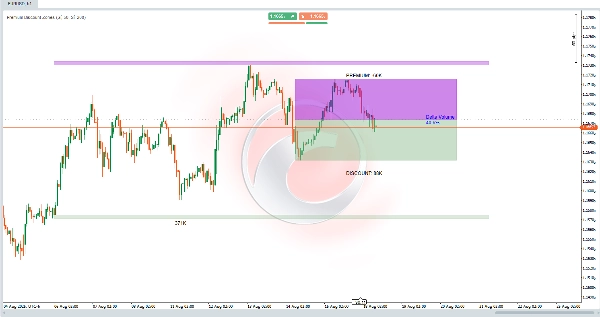
Co robi wskaźnik Premium Discount Zones? 🎯
Ten wskaźnik został zaprojektowany, aby pomóc Ci zidentyfikować kluczowe obszary na podstawie ostatnich maksimów i minimów rynku. Analizuje konfigurowalny okres poprzednich świec, aby określić ogólny zakres cenowy, oblicza punkt równowagi środkowej, i dzieli ten zakres na dwie główne strefy:
- 🔺 Premium (Strefa Górna)
- 🟩 Discount (Strefa Dolna)
Ocenia również wolumen obrotu w tych świecach, aby obliczyć "Delta Wolumenu", która reprezentuje procent wolumenu związanego z ruchami niedźwiedzi.
Do czego służy? 💡
Ten wskaźnik pomaga zlokalizować obszary, gdzie cena może być:
- 📈 Przewartościowana (Strefa Premium) → Potencjał do sprzedaży lub realizacji zysków
- 📉 Niedowartościowana (Strefa Discount) → Potencjał do zakupu lub akumulacji
Daje szybki wgląd w nierównowagi rynkowe, podkreślając, czy ostatni wolumen sprzyja ruchom byczym czy niedźwiedzim. rozszerzone strefy strukturalne projekcje kluczowych poziomów poza bezpośrednim zakresem, przydatne do planowania transakcji w trendach lub odwróceniach. 🚀
Idealny do strategii celujących w zakresy konsolidacji, wybicia, handel instytucjonalny lub analizę płynności!
Jak to interpretować? 🔍
- 🟣 Strefa Premium (Fioletowa, powyżej równowagi) → Górny zakres, gdzie cena jest uważana za "drogą."
- 🟢 Strefa Discount (Zielona, poniżej równowagi) → Dolny zakres, gdzie cena jest postrzegana jako "tania."
- ⚖️ Linia Równowagi (Szara, środek) → Oznacza środek zakresu, działając jako poziom równowagi. Przebicie ceny tutaj może sygnalizować zmianę nastawienia.
- 📊 Delta Wolumenu (Centrum) → Pokazuje procent wolumenu niedźwiedziego (🔴 >50% = niedźwiedzi, 🔵 <50% = byczy).
- 🏛 Strefy Strukturalne (Cieniowane rozszerzenia) → Rozszerzone obszary powyżej/poniżej ekstremów zakresu, działające jako długoterminowe wsparcie/opór z buforem opartym na ostatnich ruchach cen.
Wskaźnik dynamicznie aktualizuje te strefy na podstawie ostatnich świec, rozszerzając je w prawo dla przyszłych projekcji.
Jak używać go w handlu? 🛠️
- Początkowa konfiguracja:
-
- Włącz poziomy PD (główne) i strefy strukturalne jeśli chcesz.
- Dostosuj okresy retrospektywne:
-
- Krótki (np. 50 świec) → Ostatnie zakresy
- Długi (np. 200 świec) → Kontekst strukturalny
- Analiza wykresu (np. interwał H1):
-
- Sprawdź, czy cena znajduje się w 🟣 Premium (rozważ sprzedaż przy potwierdzeniu niedźwiedzim) lub 🟢 Discount (rozważ zakup przy potwierdzeniu byczym).
- Użyj Delty Wolumenu do potwierdzenia:
-
- 🔴 >50% → Sprzyja shortom w Premium
- 🔵 <50% → Sprzyja longom w Discount
- Strategie wejścia i wyjścia:
-
- 🟢 Kupuj w Strefie Discount: Jeśli cena wejdzie do zielonej strefy i delta jest niska, szukaj wejść długich ze stopami poniżej minimum strefy i celami na równowadze lub Premium.
- 🟣 Sprzedawaj w Strefie Premium: Jeśli cena osiągnie fioletową strefę i delta jest wysoka, rozważ shorty ze stopami powyżej maksimum strefy i celami na równowadze lub Discount.
- 🏛 Używaj Stref Strukturalnych do transakcji długoterminowych, stosując bufor jako margines błędu.
Podsumowanie
The indicator also computes a Volume Delta, representing the percentage of volume associated with bearish movements, which helps confirm market bias: values above 50% favor bearish conditions, while values below 50% favor bullish conditions. Extended structural zones project key support and resistance levels beyond the immediate range, useful for planning trades in trending or reversal markets.
Users can adjust lookback periods to focus on recent ranges or broader structural context. The indicator dynamically updates these zones and extends them forward for future projections. It supports trading strategies involving consolidation ranges, breakouts, institutional trading, and liquidity analysis by providing visual cues on price valuation and volume-driven market imbalances.


